

| << Chapter < Page | Chapter >> Page > |
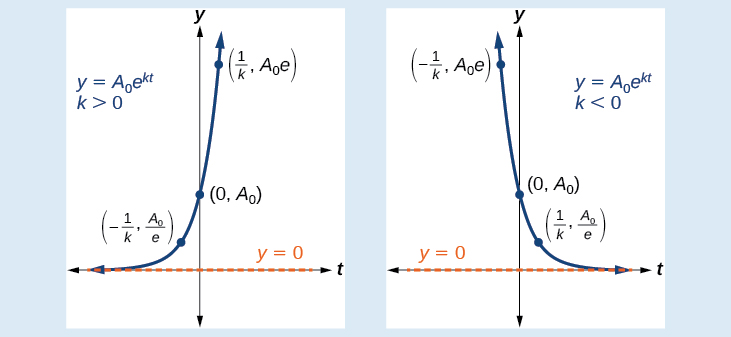
An exponential function with the form has the following characteristics:
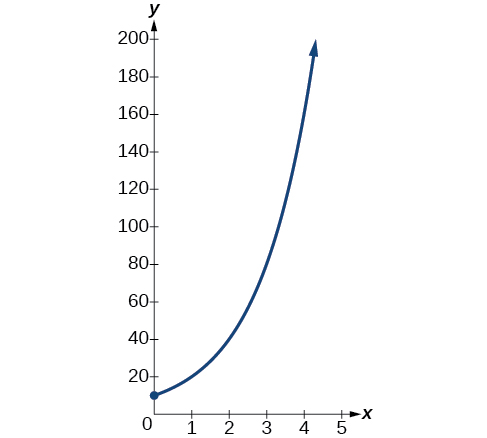
A population of bacteria doubles every hour. If the culture started with 10 bacteria, graph the population as a function of time.
When an amount grows at a fixed percent per unit time, the growth is exponential. To find we use the fact that is the amount at time zero, so To find use the fact that after one hour the population doubles from to The formula is derived as follows
so Thus the equation we want to graph is The graph is shown in [link] .
We now turn to exponential decay . One of the common terms associated with exponential decay, as stated above, is half-life , the length of time it takes an exponentially decaying quantity to decrease to half its original amount. Every radioactive isotope has a half-life, and the process describing the exponential decay of an isotope is called radioactive decay.
To find the half-life of a function describing exponential decay, solve the following equation:
We find that the half-life depends only on the constant and not on the starting quantity
The formula is derived as follows
Since the time, is positive, must, as expected, be negative. This gives us the half-life formula
Given the half-life, find the decay rate.
Note: It is also possible to find the decay rate using
The half-life of carbon-14 is 5,730 years. Express the amount of carbon-14 remaining as a function of time,
This formula is derived as follows.
The function that describes this continuous decay is We observe that the coefficient of is negative, as expected in the case of exponential decay.
The half-life of plutonium-244 is 80,000,000 years. Find function gives the amount of carbon-14 remaining as a function of time, measured in years.
The formula for radioactive decay is important in radiocarbon dating , which is used to calculate the approximate date a plant or animal died. Radiocarbon dating was discovered in 1949 by Willard Libby, who won a Nobel Prize for his discovery. It compares the difference between the ratio of two isotopes of carbon in an organic artifact or fossil to the ratio of those two isotopes in the air. It is believed to be accurate to within about 1% error for plants or animals that died within the last 60,000 years.
Notification Switch
Would you like to follow the 'Precalculus' conversation and receive update notifications?

|
|
|
|
|

|
|

|
|

|
|

|
|

|
|

|
|

|
|

|
|
|
|
|

|