

| << Chapter < Page | Chapter >> Page > |
Sketch a graph of State the domain, range, and asymptote.
Before graphing, identify the behavior and create a table of points for the graph.
Draw a smooth curve connecting the points as in [link] .
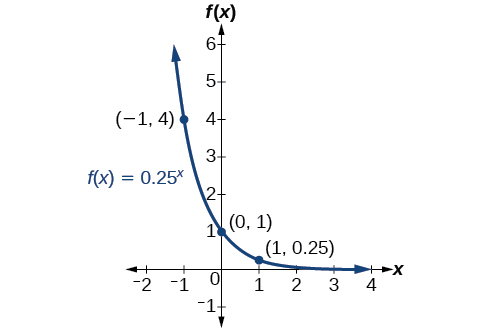
The domain is the range is the horizontal asymptote is
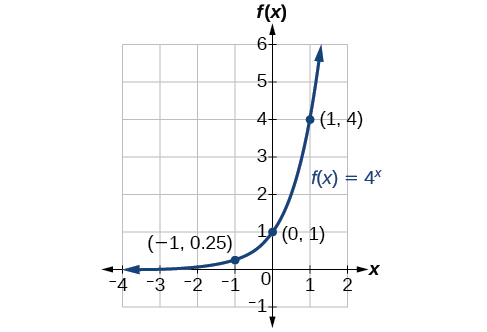
Sketch the graph of State the domain, range, and asymptote.
The domain is the range is the horizontal asymptote is
Transformations of exponential graphs behave similarly to those of other functions. Just as with other parent functions, we can apply the four types of transformations—shifts, reflections, stretches, and compressions—to the parent function without loss of shape. For instance, just as the quadratic function maintains its parabolic shape when shifted, reflected, stretched, or compressed, the exponential function also maintains its general shape regardless of the transformations applied.
The first transformation occurs when we add a constant to the parent function giving us a vertical shift units in the same direction as the sign. For example, if we begin by graphing a parent function, we can then graph two vertical shifts alongside it, using the upward shift, and the downward shift, Both vertical shifts are shown in [link] .
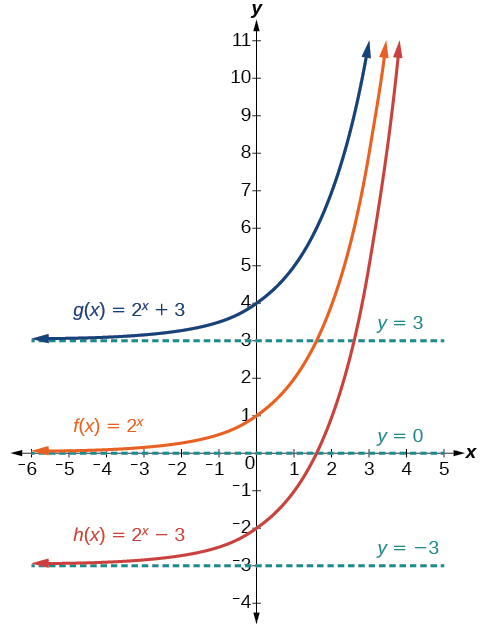
Observe the results of shifting vertically:
The next transformation occurs when we add a constant to the input of the parent function giving us a horizontal shift units in the opposite direction of the sign. For example, if we begin by graphing the parent function we can then graph two horizontal shifts alongside it, using the shift left, and the shift right, Both horizontal shifts are shown in [link] .
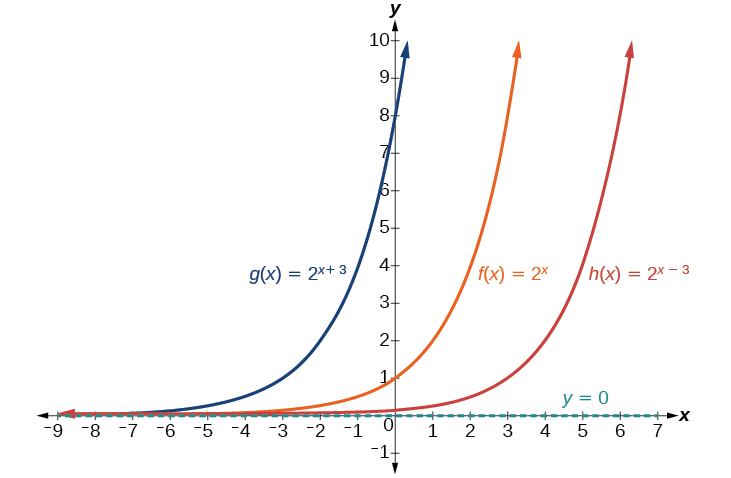
Observe the results of shifting horizontally:
Notification Switch
Would you like to follow the 'Precalculus' conversation and receive update notifications?

|
|
|
|
|

|
|

|
|

|
|

|
|
|
|
|

|
|

|
|

|
|

|
|

|