<< Chapter < Page Chapter >> Page >

Finding the amplitude and period of a function

Find the amplitude and period of the following functions and graph one cycle.

  1. y = 2 sin ( 1 4 x )
  2. y = −3 sin ( 2 x + π 2 )
  3. y = cos x + 3

We will solve these problems according to the models.

  1. y = 2 sin ( 1 4 x )   involves sine, so we use the form
    y = A sin ( B t + C ) + D

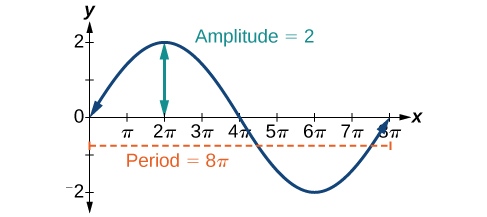
    We know that   | A |   is the amplitude, so the amplitude is 2. Period is   2 π B , so the period is

    2 π B = 2 π 1 4       = 8 π

    See the graph in [link] .

    Graph of y=2sin(1/4 x) from 0 to 8pi, which is one cycle. The amplitude is 2, and the period is 8pi.
  2. y = −3 sin ( 2 x + π 2 )   involves sine, so we use the form
    y = A sin ( B t C ) + D

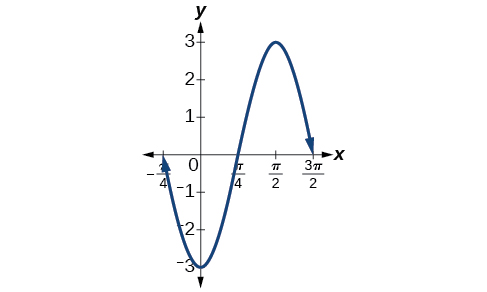
    Amplitude is   | A | , so the amplitude is   | 3 | = 3. Since   A   is negative, the graph is reflected over the x -axis. Period is   2 π B , so the period is

    2 π B = 2 π 2 = π

    The graph is shifted to the left by   C B = π 2 2 = π 4   units. See [link] .

    Graph of y=-3sin(2x+pi/2) from -pi/4 to 3pi/2, one cycle. The amplitude is 3, and the period is pi.
  3. y = cos x + 3   involves cosine, so we use the form
    y = A cos ( B t ± C ) + D

    Amplitude is   | A | ,   so the amplitude is 1. The period is   2 π .   See [link] . This is the standard cosine function shifted up three units.
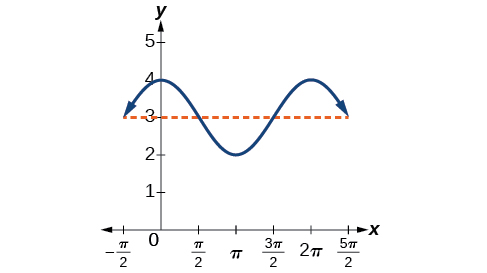
    Graph of y=cos(x) + 3 from -pi/2 to 5pi/2. The amplitude and period are the same as the normal y=cos(x), but the whole graph is shifted up on the y-axis by 3.
Got questions? Get instant answers now!

What are the amplitude and period of the function   y = 3 cos ( 3 π x ) ?

The amplitude is   3 , and the period is   2 3 .

Got questions? Get instant answers now!

Finding equations and graphing sinusoidal functions

One method of graphing sinusoidal functions is to find five key points. These points will correspond to intervals of equal length representing   1 4   of the period. The key points will indicate the location of maximum and minimum values. If there is no vertical shift, they will also indicate x -intercepts. For example, suppose we want to graph the function   y = cos θ . We know that the period is 2 π , so we find the interval between key points as follows.

2 π 4 = π 2

Starting with   θ = 0 , we calculate the first y- value, add the length of the interval   π 2   to 0, and calculate the second y -value. We then add   π 2   repeatedly until the five key points are determined. The last value should equal the first value, as the calculations cover one full period. Making a table similar to [link] , we can see these key points clearly on the graph shown in [link] .
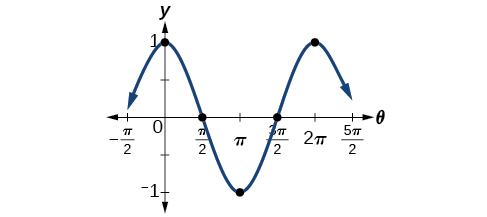
θ 0 π 2 π 3 π 2 2 π
y = cos θ 1 0 −1 0 1
Graph of y=cos(x) from -pi/2 to 5pi/2.

Graphing sinusoidal functions using key points

Graph the function   y = −4 cos ( π x )   using amplitude, period, and key points.

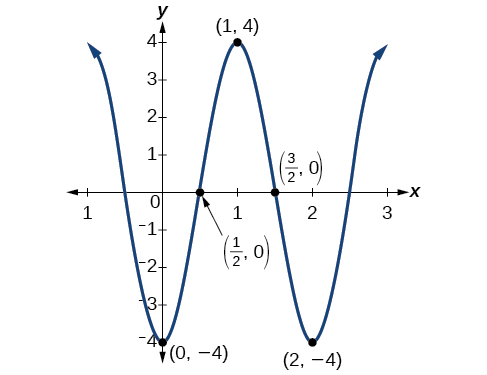
The amplitude is   | 4 | = 4.   The period is   2 π ω = 2 π π = 2.   (Recall that we sometimes refer to   B   as   ω . )   One cycle of the graph can be drawn over the interval   [ 0 , 2 ] .   To find the key points, we divide the period by 4. Make a table similar to [link] , starting with   x = 0   and then adding   1 2   successively to   x   and calculate   y .   See the graph in [link] .

x 0 1 2 1 3 2 2
y = −4 cos ( π x ) −4 0 4 0 −4
Graph of y=-4cos(pi*x) using the five key points: intervals of equal length representing 1/4 of the period. Here, the points are at 0, 1/2, 1, 3/2, and 2.
Got questions? Get instant answers now!

Graph the function   y = 3 sin ( 3 x )   using the amplitude, period, and five key points.

x 3 sin ( 3 x )
0 0
π 6 3
π 3 0
π 2 −3
2 π 3 0
Graph of y=3sin(3x) using the five key points: intervals of equal length representing 1/4 of the period. Here, the points are at 0, pi/6, pi/3, pi/2, and 2pi/3.
Got questions? Get instant answers now!

Modeling periodic behavior

We will now apply these ideas to problems involving periodic behavior.

Modeling an equation and sketching a sinusoidal graph to fit criteria

The average monthly temperatures for a small town in Oregon are given in [link] . Find a sinusoidal function of the form y = A sin ( B t C ) + D that fits the data (round to the nearest tenth) and sketch the graph.

Month Temperature, o F
January 42.5
February 44.5
March 48.5
April 52.5
May 58
June 63
July 68.5
August 69
September 64.5
October 55.5
November 46.5
December 43.5

Recall that amplitude is found using the formula

A = largest value  smallest value 2

Thus, the amplitude is

| A | = 69 42.5 2      = 13.25

The data covers a period of 12 months, so 2 π B = 12 which gives B = 2 π 12 = π 6 .

The vertical shift is found using the following equation.

D = highest value + lowest value 2


Thus, the vertical shift is

D = 69 + 42.5 2     = 55.8

So far, we have the equation y = 13.3 sin ( π 6 x C ) + 55.8.

To find the horizontal shift, we input the x and y values for the first month and solve for C .

    42.5 = 13.3 sin ( π 6 ( 1 ) C ) + 55.8 13.3 = 13.3 sin ( π 6 C )      1 = sin ( π 6 C ) sin θ = 1 θ = π 2 π 6 C = π 2 π 6 + π 2 = C            = 2 π 3

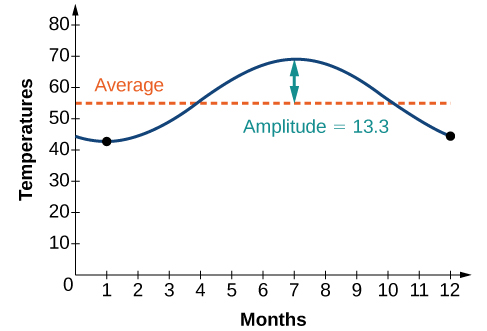
We have the equation y = 13.3 sin ( π 6 x 2 π 3 ) + 55.8. See the graph in [link] .

Graph of the equation y=13.3sin(pi/6 x - 2pi/3) + 55.8. The average value is a dotted horizontal line y=55.8, and the amplitude is 13.3
Got questions? Get instant answers now!

Questions & Answers

calculate molarity of NaOH solution when 25.0ml of NaOH titrated with 27.2ml of 0.2m H2SO4
Gasin Reply
what's Thermochemistry
rhoda Reply
the study of the heat energy which is associated with chemical reactions
Kaddija
How was CH4 and o2 was able to produce (Co2)and (H2o
Edafe Reply
explain please
Victory
First twenty elements with their valences
Martine Reply
what is chemistry
asue Reply
what is atom
asue
what is the best way to define periodic table for jamb
Damilola Reply
what is the change of matter from one state to another
Elijah Reply
what is isolation of organic compounds
IKyernum Reply
what is atomic radius
ThankGod Reply
Read Chapter 6, section 5
Dr
Read Chapter 6, section 5
Kareem
Atomic radius is the radius of the atom and is also called the orbital radius
Kareem
atomic radius is the distance between the nucleus of an atom and its valence shell
Amos
Read Chapter 6, section 5
paulino
Bohr's model of the theory atom
Ayom Reply
is there a question?
Dr
when a gas is compressed why it becomes hot?
ATOMIC
It has no oxygen then
Goldyei
read the chapter on thermochemistry...the sections on "PV" work and the First Law of Thermodynamics should help..
Dr
Which element react with water
Mukthar Reply
Mgo
Ibeh
an increase in the pressure of a gas results in the decrease of its
Valentina Reply
definition of the periodic table
Cosmos Reply
What is the lkenes
Da Reply
what were atoms composed of?
Moses Reply
Got questions? Join the online conversation and get instant answers!
Jobilize.com Reply
Practice Key Terms 2

Get Jobilize Job Search Mobile App in your pocket Now!

Get it on Google Play Download on the App Store Now


Source:  OpenStax, Precalculus. OpenStax CNX. Jan 19, 2016 Download for free at https://legacy.cnx.org/content/col11667/1.6
Google Play and the Google Play logo are trademarks of Google Inc.

Notification Switch

Would you like to follow the 'Precalculus' conversation and receive update notifications?

Ask