

| << Chapter < Page | Chapter >> Page > |
Find the amplitude and period of the following functions and graph one cycle.
We will solve these problems according to the models.
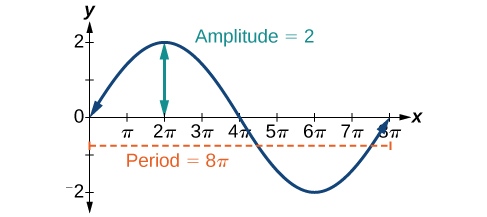
We know that is the amplitude, so the amplitude is 2. Period is so the period is
See the graph in [link] .
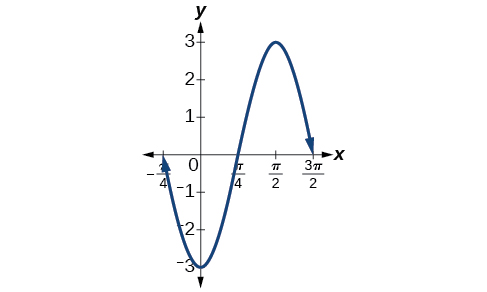
Amplitude is so the amplitude is Since is negative, the graph is reflected over the x -axis. Period is so the period is
The graph is shifted to the left by units. See [link] .
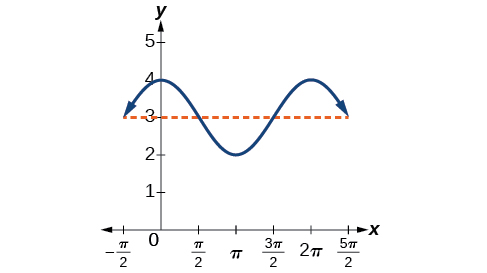
Amplitude is so the amplitude is 1. The period is See [link] . This is the standard cosine function shifted up three units.
What are the amplitude and period of the function
The amplitude is and the period is
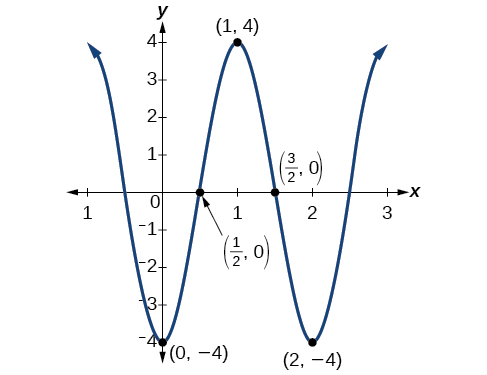
One method of graphing sinusoidal functions is to find five key points. These points will correspond to intervals of equal length representing of the period. The key points will indicate the location of maximum and minimum values. If there is no vertical shift, they will also indicate x -intercepts. For example, suppose we want to graph the function We know that the period is so we find the interval between key points as follows.
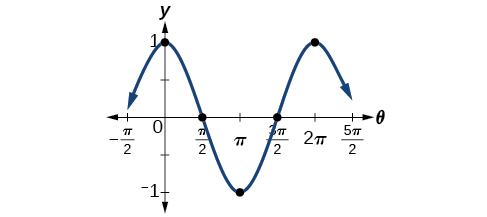
Starting with we calculate the first y- value, add the length of the interval to 0, and calculate the second y -value. We then add repeatedly until the five key points are determined. The last value should equal the first value, as the calculations cover one full period. Making a table similar to [link] , we can see these key points clearly on the graph shown in [link] .
Graph the function using amplitude, period, and key points.
The amplitude is The period is (Recall that we sometimes refer to as One cycle of the graph can be drawn over the interval To find the key points, we divide the period by 4. Make a table similar to [link] , starting with and then adding successively to and calculate See the graph in [link] .
Graph the function using the amplitude, period, and five key points.
| x | |
|---|---|
| 0 | 0 |
| 3 | |
| 0 | |
| 0 |

We will now apply these ideas to problems involving periodic behavior.
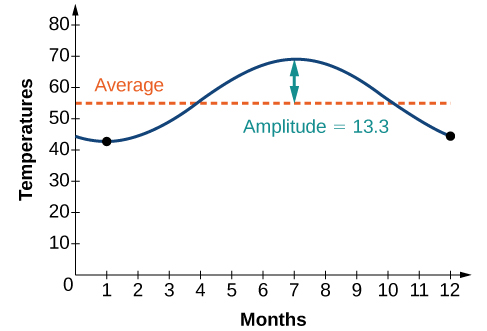
The average monthly temperatures for a small town in Oregon are given in [link] . Find a sinusoidal function of the form that fits the data (round to the nearest tenth) and sketch the graph.
| Month | Temperature, |
|---|---|
| January | 42.5 |
| February | 44.5 |
| March | 48.5 |
| April | 52.5 |
| May | 58 |
| June | 63 |
| July | 68.5 |
| August | 69 |
| September | 64.5 |
| October | 55.5 |
| November | 46.5 |
| December | 43.5 |
Recall that amplitude is found using the formula
Thus, the amplitude is
The data covers a period of 12 months, so which gives
The vertical shift is found using the following equation.
Thus, the vertical shift is
So far, we have the equation
To find the horizontal shift, we input the and values for the first month and solve for
We have the equation See the graph in [link] .
Notification Switch
Would you like to follow the 'Precalculus' conversation and receive update notifications?

|
|
|
|
|

|
|

|
|

|
|

|
|

|
|

|
|

|
|
|
|
|

|
|

|