<< Chapter < Page Chapter >> Page >
  • Graph exponential functions.
  • Graph exponential functions using transformations.

As we discussed in the previous section, exponential functions are used for many real-world applications such as finance, forensics, computer science, and most of the life sciences. Working with an equation that describes a real-world situation gives us a method for making predictions. Most of the time, however, the equation itself is not enough. We learn a lot about things by seeing their pictorial representations, and that is exactly why graphing exponential equations is a powerful tool. It gives us another layer of insight for predicting future events.

Graphing exponential functions

Before we begin graphing, it is helpful to review the behavior of exponential growth. Recall the table of values for a function of the form f ( x ) = b x whose base is greater than one. We’ll use the function f ( x ) = 2 x . Observe how the output values in [link] change as the input increases by 1.

x 3 2 1 0 1 2 3
f ( x ) = 2 x 1 8 1 4 1 2 1 2 4 8

Each output value is the product of the previous output and the base, 2. We call the base 2 the constant ratio . In fact, for any exponential function with the form f ( x ) = a b x , b is the constant ratio of the function. This means that as the input increases by 1, the output value will be the product of the base and the previous output, regardless of the value of a .

Notice from the table that

  • the output values are positive for all values of x ;
  • as x increases, the output values increase without bound; and
  • as x decreases, the output values grow smaller, approaching zero.

[link] shows the exponential growth function f ( x ) = 2 x .
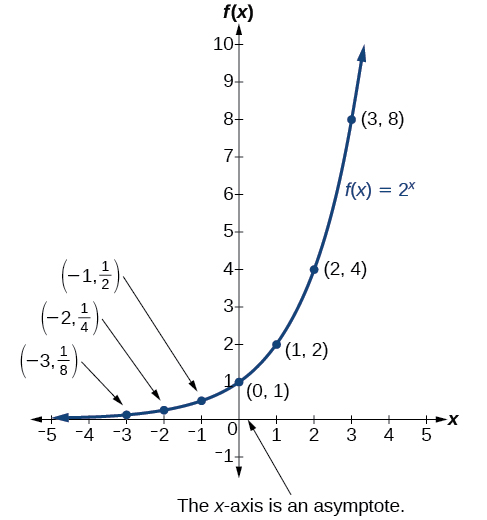
Graph of the exponential function, 2^(x), with labeled points at (-3, 1/8), (-2, ¼), (-1, ½), (0, 1), (1, 2), (2, 4), and (3, 8). The graph notes that the x-axis is an asymptote.
Notice that the graph gets close to the x -axis, but never touches it.

The domain of f ( x ) = 2 x is all real numbers, the range is ( 0 , ) , and the horizontal asymptote is y = 0.

To get a sense of the behavior of exponential decay , we can create a table of values for a function of the form f ( x ) = b x whose base is between zero and one. We’ll use the function g ( x ) = ( 1 2 ) x . Observe how the output values in [link] change as the input increases by 1.

x -3 -2 -1 0 1 2 3
g ( x ) = ( 1 2 ) x 8 4 2 1 1 2 1 4 1 8

Again, because the input is increasing by 1, each output value is the product of the previous output and the base, or constant ratio 1 2 .

Notice from the table that

  • the output values are positive for all values of x ;
  • as x increases, the output values grow smaller, approaching zero; and
  • as x decreases, the output values grow without bound.

[link] shows the exponential decay function, g ( x ) = ( 1 2 ) x .
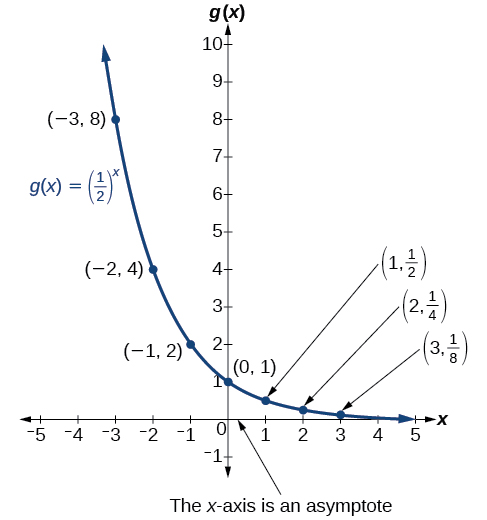
Graph of decreasing exponential function, (1/2)^x, with labeled points at (-3, 8), (-2, 4), (-1, 2), (0, 1), (1, 1/2), (2, 1/4), and (3, 1/8). The graph notes that the x-axis is an asymptote.

The domain of g ( x ) = ( 1 2 ) x is all real numbers, the range is ( 0 , ) , and the horizontal asymptote is y = 0.

Characteristics of the graph of the parent function f ( x ) = b x

An exponential function with the form f ( x ) = b x , b > 0 , b 1 , has these characteristics:

  • one-to-one function
  • horizontal asymptote: y = 0
  • domain: ( ,   )
  • range: ( 0 , )
  • x- intercept: none
  • y- intercept: ( 0 , 1 )
  • increasing if b > 1
  • decreasing if b < 1

[link] compares the graphs of exponential growth    and decay functions.
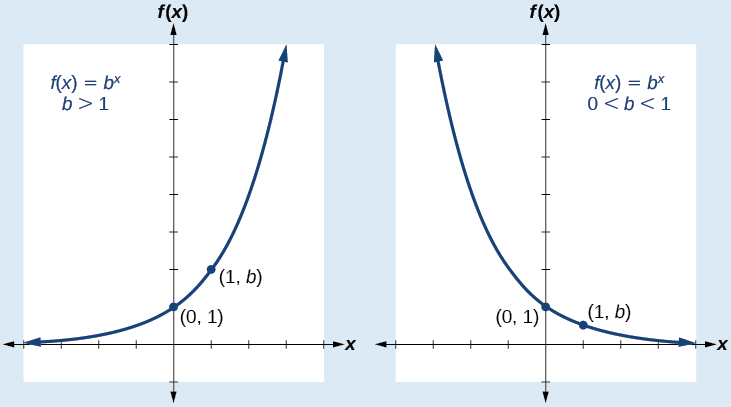
Graph of two functions where the first graph is of a function of f(x) = b^x when b>1 and the second graph is of the same function when b is 0<b<1. Both graphs have the points (0, 1) and (1, b) labeled.

Given an exponential function of the form f ( x ) = b x , graph the function.

  1. Create a table of points.
  2. Plot at least 3 point from the table, including the y -intercept ( 0 , 1 ) .
  3. Draw a smooth curve through the points.
  4. State the domain, ( , ) , the range, ( 0 , ) , and the horizontal asymptote, y = 0.

Questions & Answers

for the "hiking" mix, there are 1,000 pieces in the mix, containing 390.8 g of fat, and 165 g of protein. if there is the same amount of almonds as cashews, how many of each item is in the trail mix?
ADNAN Reply
linear speed of an object
Melissa Reply
an object is traveling around a circle with a radius of 13 meters .if in 20 seconds a central angle of 1/7 Radian is swept out what are the linear and angular speed of the object
Melissa
test
Matrix
how to find domain
Mohamed Reply
like this: (2)/(2-x) the aim is to see what will not be compatible with this rational expression. If x= 0 then the fraction is undefined since we cannot divide by zero. Therefore, the domain consist of all real numbers except 2.
Dan
define the term of domain
Moha
if a>0 then the graph is concave
Angel Reply
if a<0 then the graph is concave blank
Angel
what's a domain
Kamogelo Reply
The set of all values you can use as input into a function su h that the output each time will be defined, meaningful and real.
Spiro
how fast can i understand functions without much difficulty
Joe Reply
what is inequalities
Nathaniel
functions can be understood without a lot of difficulty. Observe the following: f(2) 2x - x 2(2)-2= 2 now observe this: (2,f(2)) ( 2, -2) 2(-x)+2 = -2 -4+2=-2
Dan
what is set?
Kelvin Reply
a colony of bacteria is growing exponentially doubling in size every 100 minutes. how much minutes will it take for the colony of bacteria to triple in size
Divya Reply
I got 300 minutes. is it right?
Patience
no. should be about 150 minutes.
Jason
It should be 158.5 minutes.
Mr
ok, thanks
Patience
100•3=300 300=50•2^x 6=2^x x=log_2(6) =2.5849625 so, 300=50•2^2.5849625 and, so, the # of bacteria will double every (100•2.5849625) = 258.49625 minutes
Thomas
158.5 This number can be developed by using algebra and logarithms. Begin by moving log(2) to the right hand side of the equation like this: t/100 log(2)= log(3) step 1: divide each side by log(2) t/100=1.58496250072 step 2: multiply each side by 100 to isolate t. t=158.49
Dan
what is the importance knowing the graph of circular functions?
Arabella Reply
can get some help basic precalculus
ismail Reply
What do you need help with?
Andrew
how to convert general to standard form with not perfect trinomial
Camalia Reply
can get some help inverse function
ismail
Rectangle coordinate
Asma Reply
how to find for x
Jhon Reply
it depends on the equation
Robert
yeah, it does. why do we attempt to gain all of them one side or the other?
Melissa
how to find x: 12x = 144 notice how 12 is being multiplied by x. Therefore division is needed to isolate x and whatever we do to one side of the equation we must do to the other. That develops this: x= 144/12 divide 144 by 12 to get x. addition: 12+x= 14 subtract 12 by each side. x =2
Dan
whats a domain
mike Reply
The domain of a function is the set of all input on which the function is defined. For example all real numbers are the Domain of any Polynomial function.
Spiro
Spiro; thanks for putting it out there like that, 😁
Melissa
foci (–7,–17) and (–7,17), the absolute value of the differenceof the distances of any point from the foci is 24.
Churlene Reply

Get Jobilize Job Search Mobile App in your pocket Now!

Get it on Google Play Download on the App Store Now


Source:  OpenStax, Precalculus. OpenStax CNX. Jan 19, 2016 Download for free at https://legacy.cnx.org/content/col11667/1.6
Google Play and the Google Play logo are trademarks of Google Inc.

Notification Switch

Would you like to follow the 'Precalculus' conversation and receive update notifications?

Ask