<< Chapter < Page Chapter >> Page >
By the end of this section, you will be able to:
  • Describe the model of the quantum harmonic oscillator
  • Identify differences between the classical and quantum models of the harmonic oscillator
  • Explain physical situations where the classical and the quantum models coincide

Oscillations are found throughout nature, in such things as electromagnetic waves, vibrating molecules, and the gentle back-and-forth sway of a tree branch. In previous chapters, we used Newtonian mechanics to study macroscopic oscillations, such as a block on a spring and a simple pendulum. In this chapter, we begin to study oscillating systems using quantum mechanics. We begin with a review of the classic harmonic oscillator.

The classic harmonic oscillator

A simple harmonic oscillator is a particle or system that undergoes harmonic motion about an equilibrium position, such as an object with mass vibrating on a spring. In this section, we consider oscillations in one-dimension only. Suppose a mass moves back-and-forth along the

x -direction about the equilibrium position, x = 0 . In classical mechanics, the particle moves in response to a linear restoring force given by F x = k x , where x is the displacement of the particle from its equilibrium position. The motion takes place between two turning points, x = ± A , where A denotes the amplitude of the motion. The position of the object varies periodically in time with angular frequency ω = k / m , which depends on the mass m of the oscillator and on the force constant k of the net force, and can be written as

x ( t ) = A cos ( ω t + ϕ ) .

The total energy E of an oscillator is the sum of its kinetic energy K = m u 2 / 2 and the elastic potential energy of the force U ( x ) = k x 2 / 2 ,

E = 1 2 m u 2 + 1 2 k x 2 .

At turning points x = ± A , the speed of the oscillator is zero; therefore, at these points, the energy of oscillation is solely in the form of potential energy E = k A 2 / 2 . The plot of the potential energy U ( x ) of the oscillator versus its position x is a parabola ( [link] ). The potential-energy function is a quadratic function of x , measured with respect to the equilibrium position. On the same graph, we also plot the total energy E of the oscillator, as a horizontal line that intercepts the parabola at x = ± A . Then the kinetic energy K is represented as the vertical distance between the line of total energy and the potential energy parabola.

A graph of the potential U of x and energy E is shown. The vertical axis is energy and the horizontal axis is x. The energy E is positive and constant. The potential U of x is the function one half k times x squared, a concave up parabola whose value is zero at x=0. The region below the U of x curve is shaded. U of x is equal to E at x equal to minus A and x equal to plus A.
The potential energy well of a classical harmonic oscillator: The motion is confined between turning points at x = A and at x = + A . The energy of oscillations is E = k A 2 / 2 .

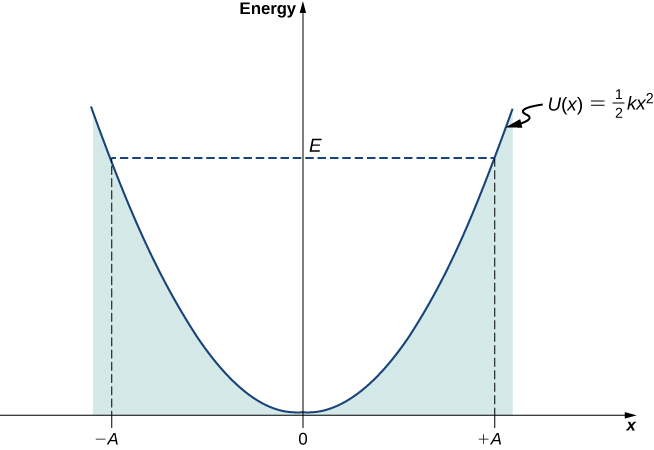
In this plot, the motion of a classical oscillator is confined to the region where its kinetic energy is nonnegative, which is what the energy relation [link] says. Physically, it means that a classical oscillator can never be found beyond its turning points, and its energy depends only on how far the turning points are from its equilibrium position. The energy of a classical oscillator changes in a continuous way. The lowest energy that a classical oscillator may have is zero, which corresponds to a situation where an object is at rest at its equilibrium position. The zero-energy state of a classical oscillator simply means no oscillations and no motion at all (a classical particle sitting at the bottom of the potential well in [link] ). When an object oscillates, no matter how big or small its energy may be, it spends the longest time near the turning points, because this is where it slows down and reverses its direction of motion. Therefore, the probability of finding a classical oscillator between the turning points is highest near the turning points and lowest at the equilibrium position. (Note that this is not a statement of preference of the object to go to lower energy. It is a statement about how quickly the object moves through various regions.)

Questions & Answers

What are the factors that affect demand for a commodity
Florence Reply
differentiate between demand and supply giving examples
Lambiv Reply
differentiated between demand and supply using examples
Lambiv
what is labour ?
Lambiv
how will I do?
Venny Reply
how is the graph works?I don't fully understand
Rezat Reply
information
Eliyee
devaluation
Eliyee
t
WARKISA
hi guys good evening to all
Lambiv
multiple choice question
Aster Reply
appreciation
Eliyee
explain perfect market
Lindiwe Reply
In economics, a perfect market refers to a theoretical construct where all participants have perfect information, goods are homogenous, there are no barriers to entry or exit, and prices are determined solely by supply and demand. It's an idealized model used for analysis,
Ezea
What is ceteris paribus?
Shukri Reply
other things being equal
AI-Robot
When MP₁ becomes negative, TP start to decline. Extuples Suppose that the short-run production function of certain cut-flower firm is given by: Q=4KL-0.6K2 - 0.112 • Where is quantity of cut flower produced, I is labour input and K is fixed capital input (K-5). Determine the average product of lab
Kelo
Extuples Suppose that the short-run production function of certain cut-flower firm is given by: Q=4KL-0.6K2 - 0.112 • Where is quantity of cut flower produced, I is labour input and K is fixed capital input (K-5). Determine the average product of labour (APL) and marginal product of labour (MPL)
Kelo
yes,thank you
Shukri
Can I ask you other question?
Shukri
what is monopoly mean?
Habtamu Reply
What is different between quantity demand and demand?
Shukri Reply
Quantity demanded refers to the specific amount of a good or service that consumers are willing and able to purchase at a give price and within a specific time period. Demand, on the other hand, is a broader concept that encompasses the entire relationship between price and quantity demanded
Ezea
ok
Shukri
how do you save a country economic situation when it's falling apart
Lilia Reply
what is the difference between economic growth and development
Fiker Reply
Economic growth as an increase in the production and consumption of goods and services within an economy.but Economic development as a broader concept that encompasses not only economic growth but also social & human well being.
Shukri
production function means
Jabir
What do you think is more important to focus on when considering inequality ?
Abdisa Reply
any question about economics?
Awais Reply
sir...I just want to ask one question... Define the term contract curve? if you are free please help me to find this answer 🙏
Asui
it is a curve that we get after connecting the pareto optimal combinations of two consumers after their mutually beneficial trade offs
Awais
thank you so much 👍 sir
Asui
In economics, the contract curve refers to the set of points in an Edgeworth box diagram where both parties involved in a trade cannot be made better off without making one of them worse off. It represents the Pareto efficient allocations of goods between two individuals or entities, where neither p
Cornelius
In economics, the contract curve refers to the set of points in an Edgeworth box diagram where both parties involved in a trade cannot be made better off without making one of them worse off. It represents the Pareto efficient allocations of goods between two individuals or entities,
Cornelius
Suppose a consumer consuming two commodities X and Y has The following utility function u=X0.4 Y0.6. If the price of the X and Y are 2 and 3 respectively and income Constraint is birr 50. A,Calculate quantities of x and y which maximize utility. B,Calculate value of Lagrange multiplier. C,Calculate quantities of X and Y consumed with a given price. D,alculate optimum level of output .
Feyisa Reply
Answer
Feyisa
c
Jabir
the market for lemon has 10 potential consumers, each having an individual demand curve p=101-10Qi, where p is price in dollar's per cup and Qi is the number of cups demanded per week by the i th consumer.Find the market demand curve using algebra. Draw an individual demand curve and the market dema
Gsbwnw Reply
suppose the production function is given by ( L, K)=L¼K¾.assuming capital is fixed find APL and MPL. consider the following short run production function:Q=6L²-0.4L³ a) find the value of L that maximizes output b)find the value of L that maximizes marginal product
Abdureman
Got questions? Join the online conversation and get instant answers!
Jobilize.com Reply

Get Jobilize Job Search Mobile App in your pocket Now!

Get it on Google Play Download on the App Store Now


Source:  OpenStax, University physics volume 3. OpenStax CNX. Nov 04, 2016 Download for free at http://cnx.org/content/col12067/1.4
Google Play and the Google Play logo are trademarks of Google Inc.

Notification Switch

Would you like to follow the 'University physics volume 3' conversation and receive update notifications?

Ask