<< Chapter < Page Chapter >> Page >
By the end of this section, you will be able to:
  • Calculate the intensity relative to the central maximum of the single-slit diffraction peaks
  • Calculate the intensity relative to the central maximum of an arbitrary point on the screen

To calculate the intensity of the diffraction pattern, we follow the phasor method used for calculations with ac circuits in Alternating-Current Circuits . If we consider that there are N Huygens sources across the slit shown in [link] , with each source separated by a distance D/N from its adjacent neighbors, the path difference between waves from adjacent sources reaching the arbitrary point P on the screen is ( D / N ) sin θ . This distance is equivalent to a phase difference of ( 2 π D / λ N ) sin θ . The phasor diagram for the waves arriving at the point whose angular position is θ is shown in [link] . The amplitude of the phasor for each Huygens wavelet is Δ E 0 , the amplitude of the resultant phasor is E , and the phase difference between the wavelets from the first and the last sources is

ϕ = ( 2 π λ ) D sin θ .

With N , the phasor diagram approaches a circular arc of length N Δ E 0 and radius r . Since the length of the arc is N Δ E 0 for any ϕ , the radius r of the arc must decrease as ϕ increases (or equivalently, as the phasors form tighter spirals).

Figure a shows an arc with phasors labeled delta E subscript 0. This subtends an angle at the center of the circle, through two lines labeled r. This angle is bisected and each half is labeled phi by 2. The endpoints of the arc are connected by an arrow labeled E. The tangent at one endpoint of the arc is horizontal. The tangent at the other endpoint of the arc makes an angle phi with the horizontal. Figure b shows the arc and the angle phi subtended by it. A dotted line extends from one endpoint of the arc to the opposite line r. It is perpendicular to r. It makes an angle phi with the arc and an angle 90 minus phi with the adjacent line r.
(a) Phasor diagram corresponding to the angular position θ in the single-slit diffraction pattern. The phase difference between the wavelets from the first and last sources is ϕ = ( 2 π / λ ) D sin θ . (b) The geometry of the phasor diagram.

The phasor diagram for ϕ = 0 (the center of the diffraction pattern) is shown in [link] (a) using N = 30 . In this case, the phasors are laid end to end in a straight line of length N Δ E 0 , the radius r goes to infinity, and the resultant has its maximum value E = N Δ E 0 . The intensity of the light can be obtained using the relation I = 1 2 c ε 0 E 2 from Electromagnetic Waves . The intensity of the maximum is then

I 0 = 1 2 c ε 0 ( N Δ E 0 ) 2 = 1 2 μ 0 c ( N Δ E 0 ) 2 ,

where ε 0 = 1 / μ 0 c 2 . The phasor diagrams for the first two zeros of the diffraction pattern are shown in parts (b) and (d) of the figure. In both cases, the phasors add to zero, after rotating through ϕ = 2 π rad for m = 1 and 4 π rad for m = 2 .

Figure a shows 30 phasors in a line of length N delta E subscript 0. The length of a phasor is delta E subscript 0. Figure b shows a circle with phasors pointing in the anticlockwise direction. This is labeled m equal to 1, E equal to 0. Figure c shows phasors along a circle. They start from the bottom and go one and a half times around the circle in the anticlockwise direction. An arrow from the starting point to the ending point is labeled E1. It forms a diameter of the circle. Figure c is labeled 3 by 2 pi E1 equal to N delta E0. Figure d shows phasors along a circle. They start from the bottom and go twice around the circle in the anticlockwise direction. The figure is labeled m equal to 2, E equal to 0. Figure e shows phasors along a circle. They start from the bottom and go two and a half times around the circle in the anticlockwise direction. An arrow from the starting point to the ending point is labeled E2. It forms a diameter of the circle. Figure c is labeled 5 by 2 pi E2 equal to N delta E0.
Phasor diagrams (with 30 phasors) for various points on the single-slit diffraction pattern. Multiple rotations around a given circle have been separated slightly so that the phasors can be seen. (a) Central maximum, (b) first minimum, (c) first maximum beyond central maximum, (d) second minimum, and (e) second maximum beyond central maximum.

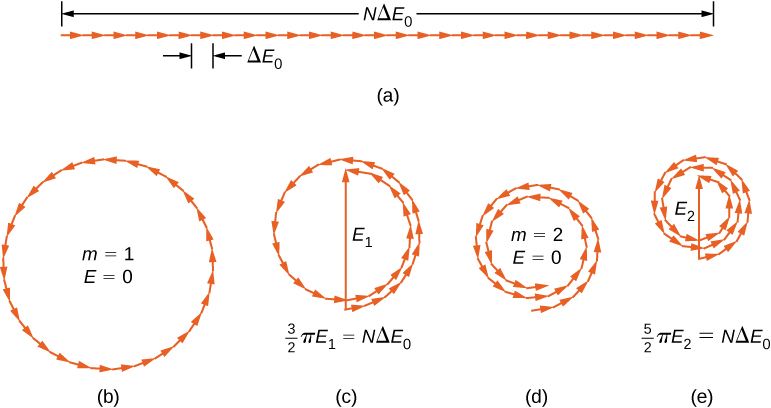
The next two maxima beyond the central maxima are represented by the phasor diagrams of parts (c) and (e). In part (c), the phasors have rotated through ϕ = 3 π rad and have formed a resultant phasor of magnitude E 1 . The length of the arc formed by the phasors is N Δ E 0 . Since this corresponds to 1.5 rotations around a circle of diameter E 1 , we have

3 2 π E 1 = N Δ E 0 ,

so

E 1 = 2 N Δ E 0 3 π

and

I 1 = 1 2 μ 0 c E 1 2 = 4 ( N Δ E 0 ) 2 ( 9 π 2 ) ( 2 μ 0 c ) = 0.045 I 0 ,

where

I 0 = ( N Δ E 0 ) 2 2 μ 0 c .

In part (e), the phasors have rotated through ϕ = 5 π rad, corresponding to 2.5 rotations around a circle of diameter E 2 and arc length N Δ E 0 . This results in I 2 = 0.016 I 0 . The proof is left as an exercise for the student ( [link] ).

Questions & Answers

Ayele, K., 2003. Introductory Economics, 3rd ed., Addis Ababa.
Widad Reply
can you send the book attached ?
Ariel
?
Ariel
What is economics
Widad Reply
the study of how humans make choices under conditions of scarcity
AI-Robot
U(x,y) = (x×y)1/2 find mu of x for y
Desalegn Reply
U(x,y) = (x×y)1/2 find mu of x for y
Desalegn
what is ecnomics
Jan Reply
this is the study of how the society manages it's scarce resources
Belonwu
what is macroeconomic
John Reply
macroeconomic is the branch of economics which studies actions, scale, activities and behaviour of the aggregate economy as a whole.
husaini
etc
husaini
difference between firm and industry
husaini Reply
what's the difference between a firm and an industry
Abdul
firm is the unit which transform inputs to output where as industry contain combination of firms with similar production 😅😅
Abdulraufu
Suppose the demand function that a firm faces shifted from Qd  120 3P to Qd  90  3P and the supply function has shifted from QS  20  2P to QS 10  2P . a) Find the effect of this change on price and quantity. b) Which of the changes in demand and supply is higher?
Toofiq Reply
explain standard reason why economic is a science
innocent Reply
factors influencing supply
Petrus Reply
what is economic.
Milan Reply
scares means__________________ends resources. unlimited
Jan
economics is a science that studies human behaviour as a relationship b/w ends and scares means which have alternative uses
Jan
calculate the profit maximizing for demand and supply
Zarshad Reply
Why qualify 28 supplies
Milan
what are explicit costs
Nomsa Reply
out-of-pocket costs for a firm, for example, payments for wages and salaries, rent, or materials
AI-Robot
concepts of supply in microeconomics
David Reply
economic overview notes
Amahle Reply
identify a demand and a supply curve
Salome Reply
i don't know
Parul
there's a difference
Aryan
Demand curve shows that how supply and others conditions affect on demand of a particular thing and what percent demand increase whith increase of supply of goods
Israr
Hi Sir please how do u calculate Cross elastic demand and income elastic demand?
Abari
Got questions? Join the online conversation and get instant answers!
Jobilize.com Reply
Practice Key Terms 1

Get Jobilize Job Search Mobile App in your pocket Now!

Get it on Google Play Download on the App Store Now


Source:  OpenStax, University physics volume 3. OpenStax CNX. Nov 04, 2016 Download for free at http://cnx.org/content/col12067/1.4
Google Play and the Google Play logo are trademarks of Google Inc.

Notification Switch

Would you like to follow the 'University physics volume 3' conversation and receive update notifications?

Ask