

| << Chapter < Page | Chapter >> Page > |
The Dutch physicist Christiaan Huygens (1629–1695) thought that light was a wave, but Isaac Newton did not. Newton thought that there were other explanations for color, and for the interference and diffraction effects that were observable at the time. Owing to Newton’s tremendous reputation, his view generally prevailed; the fact that Huygens’s principle worked was not considered direct evidence proving that light is a wave. The acceptance of the wave character of light came many years later in 1801, when the English physicist and physician Thomas Young (1773–1829) demonstrated optical interference with his now-classic double-slit experiment.
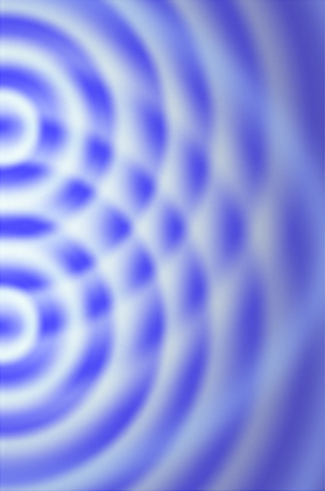
If there were not one but two sources of waves, the waves could be made to interfere, as in the case of waves on water ( [link] ). If light is an electromagnetic wave, it must therefore exhibit interference effects under appropriate circumstances. In Young’s experiment, sunlight was passed through a pinhole on a board. The emerging beam fell on two pinholes on a second board. The light emanating from the two pinholes then fell on a screen where a pattern of bright and dark spots was observed. This pattern, called fringes, can only be explained through interference, a wave phenomenon.
We can analyze double-slit interference with the help of [link] , which depicts an apparatus analogous to Young’s. Light from a monochromatic source falls on a slit . The light emanating from is incident on two other slits and that are equidistant from . A pattern of interference fringes on the screen is then produced by the light emanating from and . All slits are assumed to be so narrow that they can be considered secondary point sources for Huygens’ wavelets ( The Nature of Light ). Slits and are a distance d apart ( ), and the distance between the screen and the slits is , which is much greater than d.
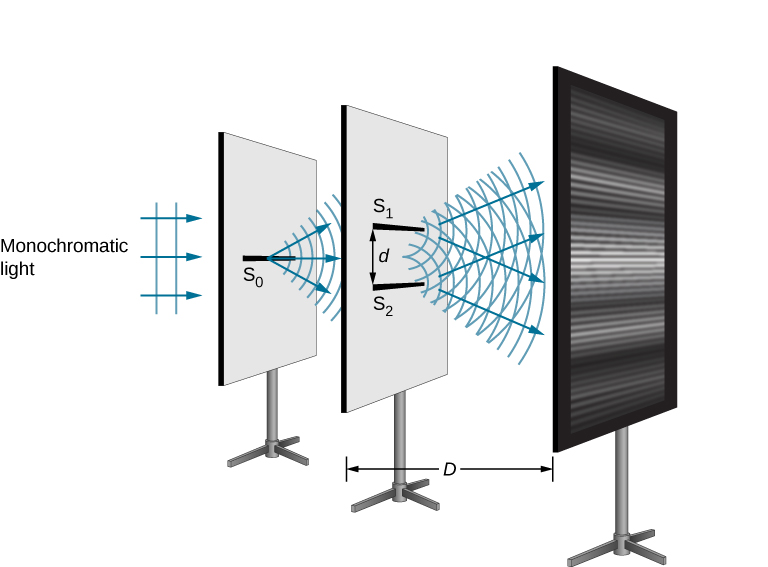
Since is assumed to be a point source of monochromatic light, the secondary Huygens wavelets leaving and always maintain a constant phase difference (zero in this case because and are equidistant from ) and have the same frequency. The sources and are then said to be coherent. By coherent waves , we mean the waves are in phase or have a definite phase relationship. The term incoherent means the waves have random phase relationships, which would be the case if and were illuminated by two independent light sources, rather than a single source . Two independent light sources (which may be two separate areas within the same lamp or the Sun) would generally not emit their light in unison, that is, not coherently. Also, because and are the same distance from , the amplitudes of the two Huygens wavelets are equal.
Notification Switch
Would you like to follow the 'University physics volume 3' conversation and receive update notifications?

|
|

|
|

|
|

|
|

|
|

|
|

|
|

|
|

|
|

|