<< Chapter < Page Chapter >> Page >

Always keep in mind that field lines serve only as a convenient way to visualize the electric field; they are not physical entities. Although the direction and relative intensity of the electric field can be deduced from a set of field lines, the lines can also be misleading. For example, the field lines drawn to represent the electric field in a region must, by necessity, be discrete. However, the actual electric field in that region exists at every point in space.

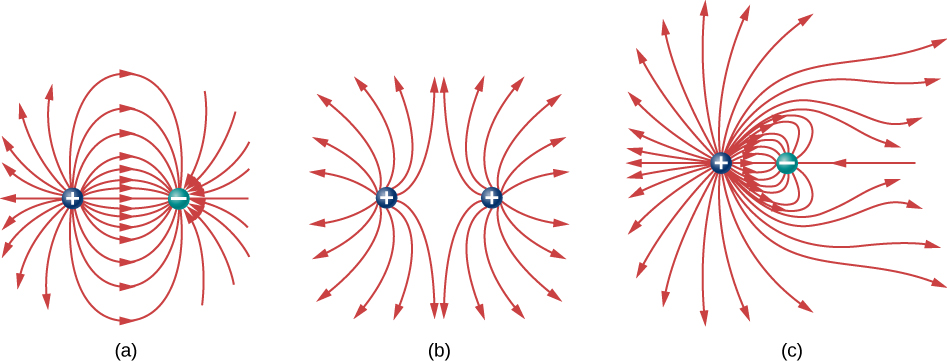
Field lines for three groups of discrete charges are shown in [link] . Since the charges in parts (a) and (b) have the same magnitude, the same number of field lines are shown starting from or terminating on each charge. In (c), however, we draw three times as many field lines leaving the + 3 q charge as entering the q . The field lines that do not terminate at q emanate outward from the charge configuration, to infinity.

Three pairs of charges and their field lines are shown. The charge on the left is positive in each case. In part a, the charge on the right is negative. The field lines are represented by curved arrows starting at the positive charge on the left, curving toward and terminating at the negative charge on the right. Between the charges, the field lines are dense. In part b, the charge on the right is positive. The field lines represented by curved arrows start at each of the positive charges and diverge outward. Between the charges, the field lines are less dense, and there is a black region midway between the charges. In part c, the charge on the right is negative. The field lines start at the positive charge. Some of the lines, those that start closest to the negative charge, curve toward the negative charge and terminate there. Lines that start further from the negative charge curve toward it but then diverge outward. There is an area with very low density of lines to the right of the pair of charges.
Three typical electric field diagrams. (a) A dipole. (b) Two identical charges. (c) Two charges with opposite signs and different magnitudes. Can you tell from the diagram which charge has the larger magnitude?

The ability to construct an accurate electric field diagram is an important, useful skill; it makes it much easier to estimate, predict, and therefore calculate the electric field of a source charge. The best way to develop this skill is with software that allows you to place source charges and then will draw the net field upon request. We strongly urge you to search the Internet for a program. Once you’ve found one you like, run several simulations to get the essential ideas of field diagram construction. Then practice drawing field diagrams, and checking your predictions with the computer-drawn diagrams.

One example of a field-line drawing program is from the PhET “Charges and Fields” simulation.

Summary

  • Electric field diagrams assist in visualizing the field of a source charge.
  • The magnitude of the field is proportional to the field line density.
  • Field vectors are everywhere tangent to field lines.

Conceptual questions

If a point charge is released from rest in a uniform electric field, will it follow a field line? Will it do so if the electric field is not uniform?

yes; no

Got questions? Get instant answers now!

Under what conditions, if any, will the trajectory of a charged particle not follow a field line?

Got questions? Get instant answers now!

How would you experimentally distinguish an electric field from a gravitational field?

At the surface of Earth, the gravitational field is always directed in toward Earth’s center. An electric field could move a charged particle in a different direction than toward the center of Earth. This would indicate an electric field is present.

Got questions? Get instant answers now!

A representation of an electric field shows 10 field lines perpendicular to a square plate. How many field lines should pass perpendicularly through the plate to depict a field with twice the magnitude?

Got questions? Get instant answers now!

What is the ratio of the number of electric field lines leaving a charge 10 q and a charge q ?

10

Got questions? Get instant answers now!

Problems

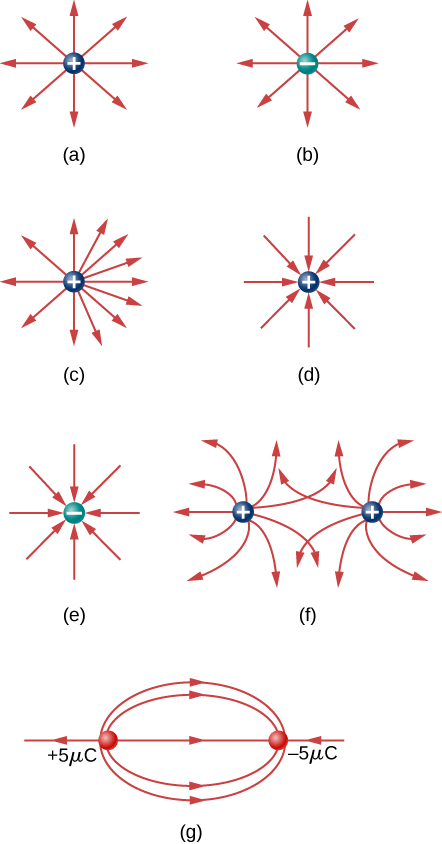
Which of the following electric field lines are incorrect for point charges? Explain why.

Figure a shows field lines pointing away from a positive charge. The lines are uniformly distributed around the charge. Figure b shows field lines pointing away from a negative charge. The lines are uniformly distributed around the charge. Figure c shows field lines pointing away from a positive charge. The lines are denser on the right side of the charge than on the left. Figure d shows field lines pointing toward a positive charge. The lines are uniformly distributed around the charge. Figure e shows field lines pointing toward a negative charge. The lines are uniformly distributed around the charge. Figure f shows two positive charges. Field lines start at each positive charge and point away from each. The lines are uniformly distributed at the charges and bend away from the midline. Some lines intersect each other. Figure g shows a positive 5 micro Coulomb charge and a negative micro Coulomb charge. Several field lines are shown. Long the line connecting the charges is a field line that points away from the positive charge and toward the negative one. Another field line forms an ellipse that starts at the positive charge and ends at the negative charge. Another field line also forms an ellipse that points away from the positive and ends at the negative charge but appears to envelop the charges rather than start and end at the charges.
Got questions? Get instant answers now!

In this exercise, you will practice drawing electric field lines. Make sure you represent both the magnitude and direction of the electric field adequately. Note that the number of lines into or out of charges is proportional to the charges.

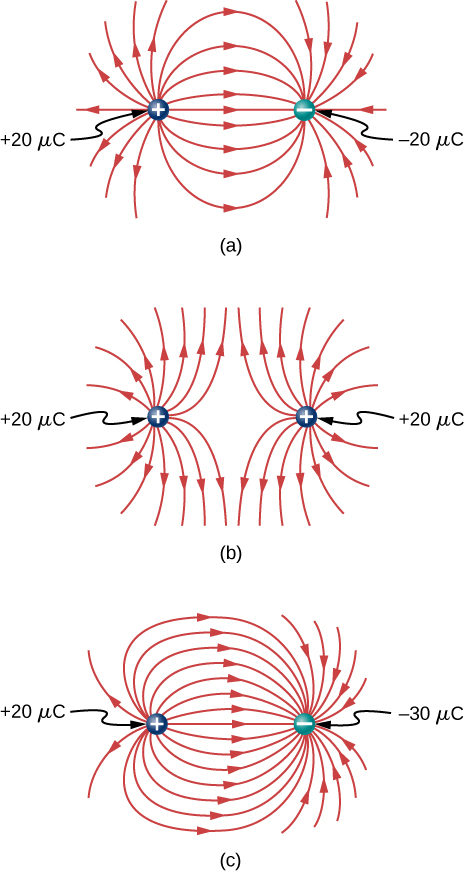
(a) Draw the electric field lines map for two charges + 20 μ C and −20 μ C situated 5 cm from each other.

(b) Draw the electric field lines map for two charges + 20 μ C and + 20 μ C situated 5 cm from each other.

(c) Draw the electric field lines map for two charges + 20 μ C and −30 μ C situated 5 cm from each other.


Figure a shows a positive 20 micro Coulomb charge on the left, a negative 20 micro Coulomb charge on the right, and the field lines due to the charges. The field lines come out of the positive charge and converge coming into the negative charge. The outer field lines extend beyond the drawing area and so we see them bending to the right, toward the negative charge, but only see part of the line. The density of lines coming out of the positive is the same as the density going into the negative. Figure b shows a positive 20 micro Coulomb charge on the left, a positive 20 micro Coulomb charge on the right, and the field lines due to the charges. The field lines come out of the positive charges and diverge, bending away from the far charge. The density of lines is the same near each of the charges. Figure c shows a positive 20 micro Coulomb charge on the left, a negative 30 micro Coulomb charge on the right, and the field lines due to the charges. The field lines come out of the positive charge. More lines go into the negative 20 micro Coulomb charge than come out of the positive 20 micro Coulomb charge. All of the lines coming out of the positive charge terminate at the negative, while the outer lines going into the negative start at infinity.

Got questions? Get instant answers now!

Draw the electric field for a system of three particles of charges + 1 μ C , + 2 μ C , and −3 μ C fixed at the corners of an equilateral triangle of side 2 cm.

Got questions? Get instant answers now!

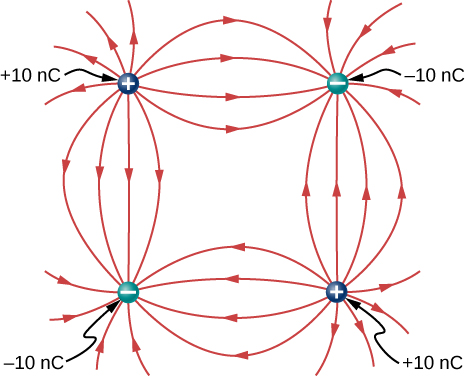
Two charges of equal magnitude but opposite sign make up an electric dipole. A quadrupole consists of two electric dipoles are placed anti-parallel at two edges of a square as shown.

Four charges are shown at the corners of a square. At the top left is positive 10 nano Coulombs. At the top right is negative 10 nano Coulombs. At the bottom left is negative 10 nano Coulombs. At the bottom right is positive 10 nano Coulombs.

Draw the electric field of the charge distribution.


Four charges are shown at the corners of a square. At the top left is positive 10 nano Coulombs. At the top right is negative 10 nano Coulombs. At the bottom left is negative 10 nano Coulombs. At the bottom right is positive 10 nano Coulombs. The field lines are also shown. They come out of the positive charges and curve toward and end at the negative charges. The lowest density is near the center of the square.

Got questions? Get instant answers now!

Suppose the electric field of an isolated point charge decreased with distance as 1 / r 2 + δ rather than as 1 / r 2 . Show that it is then impossible to draw continous field lines so that their number per unit area is proportional to E .

Got questions? Get instant answers now!

Questions & Answers

differentiate between demand and supply giving examples
Lambiv Reply
differentiated between demand and supply using examples
Lambiv
what is labour ?
Lambiv
how will I do?
Venny Reply
how is the graph works?I don't fully understand
Rezat Reply
information
Eliyee
devaluation
Eliyee
t
WARKISA
hi guys good evening to all
Lambiv
multiple choice question
Aster Reply
appreciation
Eliyee
explain perfect market
Lindiwe Reply
In economics, a perfect market refers to a theoretical construct where all participants have perfect information, goods are homogenous, there are no barriers to entry or exit, and prices are determined solely by supply and demand. It's an idealized model used for analysis,
Ezea
What is ceteris paribus?
Shukri Reply
other things being equal
AI-Robot
When MP₁ becomes negative, TP start to decline. Extuples Suppose that the short-run production function of certain cut-flower firm is given by: Q=4KL-0.6K2 - 0.112 • Where is quantity of cut flower produced, I is labour input and K is fixed capital input (K-5). Determine the average product of lab
Kelo
Extuples Suppose that the short-run production function of certain cut-flower firm is given by: Q=4KL-0.6K2 - 0.112 • Where is quantity of cut flower produced, I is labour input and K is fixed capital input (K-5). Determine the average product of labour (APL) and marginal product of labour (MPL)
Kelo
yes,thank you
Shukri
Can I ask you other question?
Shukri
what is monopoly mean?
Habtamu Reply
What is different between quantity demand and demand?
Shukri Reply
Quantity demanded refers to the specific amount of a good or service that consumers are willing and able to purchase at a give price and within a specific time period. Demand, on the other hand, is a broader concept that encompasses the entire relationship between price and quantity demanded
Ezea
ok
Shukri
how do you save a country economic situation when it's falling apart
Lilia Reply
what is the difference between economic growth and development
Fiker Reply
Economic growth as an increase in the production and consumption of goods and services within an economy.but Economic development as a broader concept that encompasses not only economic growth but also social & human well being.
Shukri
production function means
Jabir
What do you think is more important to focus on when considering inequality ?
Abdisa Reply
any question about economics?
Awais Reply
sir...I just want to ask one question... Define the term contract curve? if you are free please help me to find this answer 🙏
Asui
it is a curve that we get after connecting the pareto optimal combinations of two consumers after their mutually beneficial trade offs
Awais
thank you so much 👍 sir
Asui
In economics, the contract curve refers to the set of points in an Edgeworth box diagram where both parties involved in a trade cannot be made better off without making one of them worse off. It represents the Pareto efficient allocations of goods between two individuals or entities, where neither p
Cornelius
In economics, the contract curve refers to the set of points in an Edgeworth box diagram where both parties involved in a trade cannot be made better off without making one of them worse off. It represents the Pareto efficient allocations of goods between two individuals or entities,
Cornelius
Suppose a consumer consuming two commodities X and Y has The following utility function u=X0.4 Y0.6. If the price of the X and Y are 2 and 3 respectively and income Constraint is birr 50. A,Calculate quantities of x and y which maximize utility. B,Calculate value of Lagrange multiplier. C,Calculate quantities of X and Y consumed with a given price. D,alculate optimum level of output .
Feyisa Reply
Answer
Feyisa
c
Jabir
the market for lemon has 10 potential consumers, each having an individual demand curve p=101-10Qi, where p is price in dollar's per cup and Qi is the number of cups demanded per week by the i th consumer.Find the market demand curve using algebra. Draw an individual demand curve and the market dema
Gsbwnw Reply
suppose the production function is given by ( L, K)=L¼K¾.assuming capital is fixed find APL and MPL. consider the following short run production function:Q=6L²-0.4L³ a) find the value of L that maximizes output b)find the value of L that maximizes marginal product
Abdureman
types of unemployment
Yomi Reply
What is the difference between perfect competition and monopolistic competition?
Mohammed
Got questions? Join the online conversation and get instant answers!
Jobilize.com Reply
Practice Key Terms 2

Get Jobilize Job Search Mobile App in your pocket Now!

Get it on Google Play Download on the App Store Now


Source:  OpenStax, University physics volume 2. OpenStax CNX. Oct 06, 2016 Download for free at http://cnx.org/content/col12074/1.3
Google Play and the Google Play logo are trademarks of Google Inc.

Notification Switch

Would you like to follow the 'University physics volume 2' conversation and receive update notifications?

Ask