<< Chapter < Page Chapter >> Page >
By the end of the section, you will be able to:
  • Interpret phasor diagrams and apply them to ac circuits with resistors, capacitors, and inductors
  • Define the reactance for a resistor, capacitor, and inductor to help understand how current in the circuit behaves compared to each of these devices

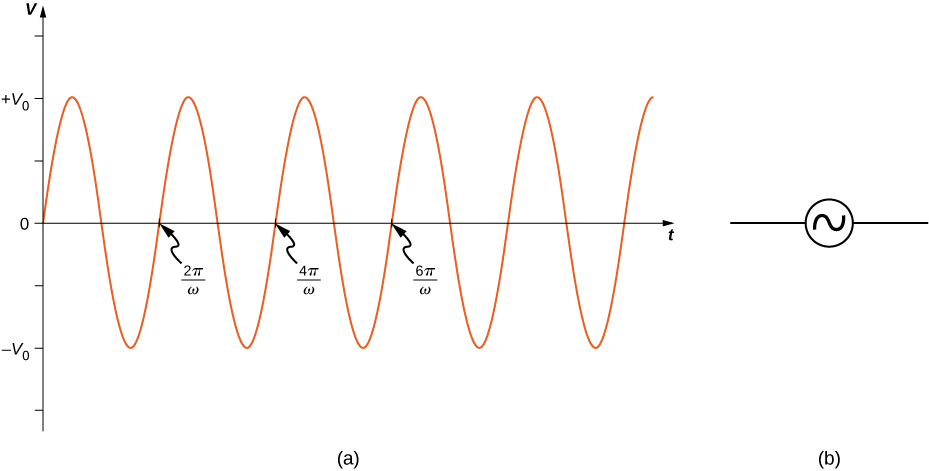
In this section, we study simple models of ac voltage sources connected to three circuit components: (1) a resistor, (2) a capacitor, and (3) an inductor. The power furnished by an ac voltage source has an emf given by

v ( t ) = V 0 sin ω t ,

as shown in [link] . This sine function assumes we start recording the voltage when it is v = 0 V at a time of t = 0 s . A phase constant may be involved that shifts the function when we start measuring voltages, similar to the phase constant in the waves we studied in Waves . However, because we are free to choose when we start examining the voltage, we can ignore this phase constant for now. We can measure this voltage across the circuit components using one of two methods: (1) a quantitative approach based on our knowledge of circuits, or (2) a graphical approach that is explained in the coming sections.

Figure shows a sine wave with maximum and minimum values of the voltage being V0 and minus V0 respectively. Each positive slope of the wave, at the x-axis, marks one complete wavelength. These points are labeled in sequence: 2 pi by omega, 4 pi by omega and 6 pi by omega.
(a) The output v ( t ) = V 0 sin ω t of an ac generator. (b) Symbol used to represent an ac voltage source in a circuit diagram.

Resistor

First, consider a resistor connected across an ac voltage source. From Kirchhoff’s loop rule, the instantaneous voltage across the resistor of [link] (a) is

v R ( t ) = V 0 sin ω t

and the instantaneous current through the resistor is
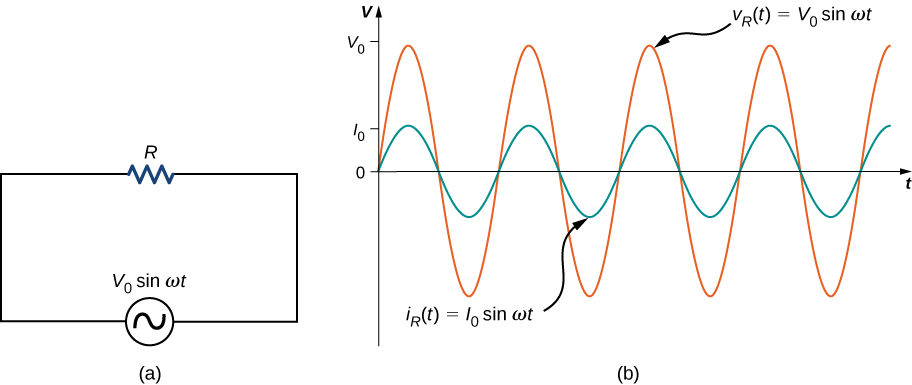
i R ( t ) = v R ( t ) R = V 0 R sin ω t = I 0 sin ω t .
Figure a shows a circuit with an AC voltage source connected to a resistor. The source is labeled V0 sine omega t. Figure b shows sine waves of AC voltage and current on the same graph. Voltage has a greater amplitude than current and its maximum value is marked V0 on the y axis. The maximum value of current is marked I0. The voltage curve is labeled V subscript R parentheses t parentheses equal to V0 sine omega t. The current curve is labeled I subscript R parentheses t parentheses equal to I0 sine omega t.
(a) A resistor connected across an ac voltage source. (b) The current i R ( t ) through the resistor and the voltage v R ( t ) across the resistor. The two quantities are in phase.

Here, I 0 = V 0 / R is the amplitude of the time-varying current. Plots of i R ( t ) and v R ( t ) are shown in [link] (b). Both curves reach their maxima and minima at the same times, that is, the current through and the voltage across the resistor are in phase.

Graphical representations of the phase relationships between current and voltage are often useful in the analysis of ac circuits. Such representations are called phasor diagrams . The phasor diagram for i R ( t ) is shown in [link] (a), with the current on the vertical axis. The arrow (or phasor) is rotating counterclockwise at a constant angular frequency ω , so we are viewing it at one instant in time. If the length of the arrow corresponds to the current amplitude I 0 , the projection of the rotating arrow onto the vertical axis is i R ( t ) = I 0 sin ω t , which is the instantaneous current.

Figure shows the coordinate axes. An arrow labeled V0 starts from the origin and points up and right making an angle omega t with the x axis. An arrow labeled omega is shown near its tip, perpendicular to it, pointing up and left. The tip of the arrow V0 makes a y-intercept labeled V subscript C parentheses t parentheses. An arrow labeled I0 starts at the origin and points up and left. It is perpendicular to V0. It makes a y intercept labeled i subscript C parentheses t parentheses. A arrow labeled omega is shown near its tip, perpendicular to it, pointing down and left.
(a) The phasor diagram representing the current through the resistor of [link] . (b) The phasor diagram representing both i R ( t ) and v R ( t ) .

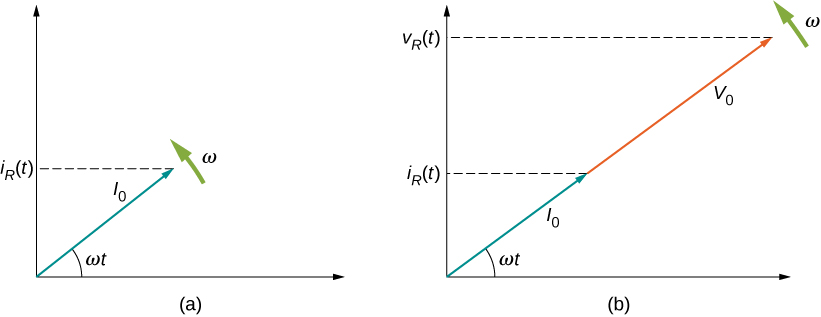
The vertical axis on a phasor diagram could be either the voltage or the current, depending on the phasor that is being examined. In addition, several quantities can be depicted on the same phasor diagram. For example, both the current i R ( t ) and the voltage v R ( t ) are shown in the diagram of [link] (b). Since they have the same frequency and are in phase, their phasors point in the same direction and rotate together. The relative lengths of the two phasors are arbitrary because they represent different quantities; however, the ratio of the lengths of the two phasors can be represented by the resistance, since one is a voltage phasor and the other is a current phasor.

Questions & Answers

Discuss the differences between taste and flavor, including how other sensory inputs contribute to our  perception of flavor.
John Reply
taste refers to your understanding of the flavor . while flavor one The other hand is refers to sort of just a blend things.
Faith
While taste primarily relies on our taste buds, flavor involves a complex interplay between taste and aroma
Kamara
which drugs can we use for ulcers
Ummi Reply
omeprazole
Kamara
what
Renee
what is this
Renee
is a drug
Kamara
of anti-ulcer
Kamara
Omeprazole Cimetidine / Tagament For the complicated once ulcer - kit
Patrick
what is the function of lymphatic system
Nency Reply
Not really sure
Eli
to drain extracellular fluid all over the body.
asegid
The lymphatic system plays several crucial roles in the human body, functioning as a key component of the immune system and contributing to the maintenance of fluid balance. Its main functions include: 1. Immune Response: The lymphatic system produces and transports lymphocytes, which are a type of
asegid
to transport fluids fats proteins and lymphocytes to the blood stream as lymph
Adama
what is anatomy
Oyindarmola Reply
Anatomy is the identification and description of the structures of living things
Kamara
what's the difference between anatomy and physiology
Oyerinde Reply
Anatomy is the study of the structure of the body, while physiology is the study of the function of the body. Anatomy looks at the body's organs and systems, while physiology looks at how those organs and systems work together to keep the body functioning.
AI-Robot
what is enzymes all about?
Mohammed Reply
Enzymes are proteins that help speed up chemical reactions in our bodies. Enzymes are essential for digestion, liver function and much more. Too much or too little of a certain enzyme can cause health problems
Kamara
yes
Prince
how does the stomach protect itself from the damaging effects of HCl
Wulku Reply
little girl okay how does the stomach protect itself from the damaging effect of HCL
Wulku
it is because of the enzyme that the stomach produce that help the stomach from the damaging effect of HCL
Kamara
function of digestive system
Ali Reply
function of digestive
Ali
the diagram of the lungs
Adaeze Reply
what is the normal body temperature
Diya Reply
37 degrees selcius
Xolo
37°c
Stephanie
please why 37 degree selcius normal temperature
Mark
36.5
Simon
37°c
Iyogho
the normal temperature is 37°c or 98.6 °Fahrenheit is important for maintaining the homeostasis in the body the body regular this temperature through the process called thermoregulation which involves brain skin muscle and other organ working together to maintain stable internal temperature
Stephanie
37A c
Wulku
what is anaemia
Diya Reply
anaemia is the decrease in RBC count hemoglobin count and PVC count
Eniola
what is the pH of the vagina
Diya Reply
how does Lysin attack pathogens
Diya
acid
Mary
I information on anatomy position and digestive system and there enzyme
Elisha Reply
anatomy of the female external genitalia
Muhammad Reply
Organ Systems Of The Human Body (Continued) Organ Systems Of The Human Body (Continued)
Theophilus Reply
what's lochia albra
Kizito
Got questions? Join the online conversation and get instant answers!
Jobilize.com Reply
Practice Key Terms 4

Get Jobilize Job Search Mobile App in your pocket Now!

Get it on Google Play Download on the App Store Now


Source:  OpenStax, University physics volume 2. OpenStax CNX. Oct 06, 2016 Download for free at http://cnx.org/content/col12074/1.3
Google Play and the Google Play logo are trademarks of Google Inc.

Notification Switch

Would you like to follow the 'University physics volume 2' conversation and receive update notifications?

Ask