<< Chapter < Page Chapter >> Page >

Check Your Understanding (a) Draw the free-body diagram for the situation shown. (b) Redraw it showing components; use x -axes parallel to the two ramps.

Two carts are tied with a rope which goes over a pulley on top of a hill. Each cart rests on one  slope of the hill on either side of the pulley. The cart on the left is labeled m1 and the one on the right is labeled m2.

Figure a shows a free body diagram of an object on a line that slopes down to the right. Arrow T from the object points right and up, parallel to the slope. Arrow N1 points left and up, perpendicular to the slope. Arrow w1 points vertically down. Figure b shows a free body diagram of an object on a line that slopes down to the left. Arrow N2 from the object points right and up, perpendicular to the slope. Arrow T points left and up, parallel to the slope. Arrow w2 points vertically down. ;
Figure a shows a free body diagram of an object on a line that slopes down to the right. Arrow T from the object points right and up, parallel to the slope. Arrow N1 points left and up, perpendicular to the slope. Arrow w1 points vertically down. Arrow w1x points left and down, parallel to the slope. Arrow w1y points right and down, perpendicular to the slope. Figure b shows a free body diagram of an object on a line that slopes down to the left. Arrow N2 from the object points right and up, perpendicular to the slope. Arrow T points left and up, parallel to the slope. Arrow w2 points vertically down. Arrow w2y points left and down, perpendicular to the slope. Arrow w2x points right and down, parallel to the slope.

Got questions? Get instant answers now!

View this simulation to predict, qualitatively, how an external force will affect the speed and direction of an object’s motion. Explain the effects with the help of a free-body diagram. Use free-body diagrams to draw position, velocity, acceleration, and force graphs, and vice versa. Explain how the graphs relate to one another. Given a scenario or a graph, sketch all four graphs.

Summary

  • To draw a free-body diagram, we draw the object of interest, draw all forces acting on that object, and resolve all force vectors into x - and y -components. We must draw a separate free-body diagram for each object in the problem.
  • A free-body diagram is a useful means of describing and analyzing all the forces that act on a body to determine equilibrium according to Newton’s first law or acceleration according to Newton’s second law.

Key equations

Net external force F net = F = F 1 + F 2 +
Newton’s first law v = constant when F net = 0 N
Newton’s second law, vector form F net = F = m a
Newton’s second law, scalar form F net = m a
Newton’s second law, component form F x = m a x , F y = m a y , and F z = m a z .
Newton’s second law, momentum form F net = d p d t
Definition of weight, vector form w = m g
Definition of weight, scalar form w = m g
Newton’s third law F AB = F BA
Normal force on an object resting on a
horizontal surface, vector form
N = m g
Normal force on an object resting on a
horizontal surface, scalar form
N = m g
Normal force on an object resting on an
inclined plane, scalar form
N = m g cos θ
Tension in a cable supporting an object
of mass m at rest, scalar form
T = w = m g

Conceptual questions

In completing the solution for a problem involving forces, what do we do after constructing the free-body diagram? That is, what do we apply?

Got questions? Get instant answers now!

If a book is located on a table, how many forces should be shown in a free-body diagram of the book? Describe them.

two forces of different types: weight acting downward and normal force acting upward

Got questions? Get instant answers now!

If the book in the previous question is in free fall, how many forces should be shown in a free-body diagram of the book? Describe them.

Got questions? Get instant answers now!

Problems

A ball of mass m hangs at rest, suspended by a string. (a) Sketch all forces. (b) Draw the free-body diagram for the ball.

Got questions? Get instant answers now!

A car moves along a horizontal road. Draw a free-body diagram; be sure to include the friction of the road that opposes the forward motion of the car.

A free body diagram shows a vector F subscript e pointing right, vector N pointing up, vector f pointing left and arrow w pointing down.

Got questions? Get instant answers now!

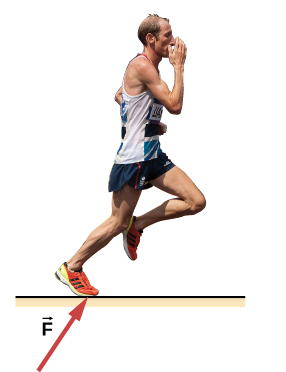
A runner pushes against the track, as shown. (a) Provide a free-body diagram showing all the forces on the runner. ( Hint: Place all forces at the center of his body, and include his weight.) (b) Give a revised diagram showing the xy -component form.

A picture of a man running towards the right is shown. An arrow labeled F points up and right from the floor towards his foot.
Got questions? Get instant answers now!

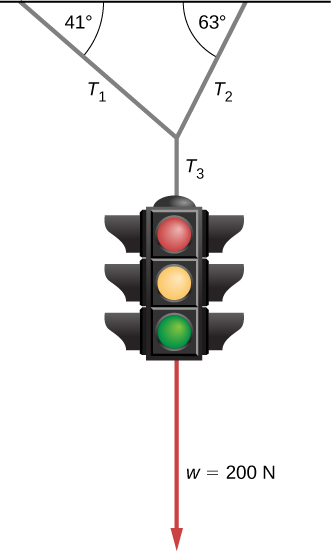
The traffic light hangs from the cables as shown. Draw a free-body diagram on a coordinate plane for this situation.

Figure shows a traffic light hanging from a horizontal cable by three other cables, T1, T2 and T3. T1 hangs down and right making an angle of 41 degrees with the horizontal cable. T2 hangs down and left, making an angle of 63 degrees with the horizontal cable. These meet at a point and T3 hangs vertically down from here. The light is attached to T3. A vector pointing down from the light is labeled w equal to 200 newtons.

Figure shows coordinate axes. Three arrows radiate out from the origin. T1, labeled 41 degrees points up and left. T2, labeled 63 degrees points up and right. T3 equal to w equal to 200 N is along the negative y axis.

Got questions? Get instant answers now!

Additional problems

Two small forces, F 1 = −2.40 i ^ 6.10 t j ^ N and F 2 = 8.50 i ^ 9.70 j ^ N, are exerted on a rogue asteroid by a pair of space tractors. (a) Find the net force. (b) What are the magnitude and direction of the net force? (c) If the mass of the asteroid is 125 kg, what acceleration does it experience (in vector form)? (d) What are the magnitude and direction of the acceleration?

Got questions? Get instant answers now!

Questions & Answers

how do you get the 2/50
Abba Reply
number of sport play by 50 student construct discrete data
Aminu Reply
width of the frangebany leaves on how to write a introduction
Theresa Reply
Solve the mean of variance
Veronica Reply
Step 1: Find the mean. To find the mean, add up all the scores, then divide them by the number of scores. ... Step 2: Find each score's deviation from the mean. ... Step 3: Square each deviation from the mean. ... Step 4: Find the sum of squares. ... Step 5: Divide the sum of squares by n – 1 or N.
kenneth
what is error
Yakuba Reply
Is mistake done to something
Vutshila
Hy
anas
hy
What is the life teble
anas
hy
Jibrin
statistics is the analyzing of data
Tajudeen Reply
what is statics?
Zelalem Reply
how do you calculate mean
Gloria Reply
diveving the sum if all values
Shaynaynay
let A1,A2 and A3 events be independent,show that (A1)^c, (A2)^c and (A3)^c are independent?
Fisaye Reply
what is statistics
Akhisani Reply
data collected all over the world
Shaynaynay
construct a less than and more than table
Imad Reply
The sample of 16 students is taken. The average age in the sample was 22 years with astandard deviation of 6 years. Construct a 95% confidence interval for the age of the population.
Aschalew Reply
Bhartdarshan' is an internet-based travel agency wherein customer can see videos of the cities they plant to visit. The number of hits daily is a normally distributed random variable with a mean of 10,000 and a standard deviation of 2,400 a. what is the probability of getting more than 12,000 hits? b. what is the probability of getting fewer than 9,000 hits?
Akshay Reply
Bhartdarshan'is an internet-based travel agency wherein customer can see videos of the cities they plan to visit. The number of hits daily is a normally distributed random variable with a mean of 10,000 and a standard deviation of 2,400. a. What is the probability of getting more than 12,000 hits
Akshay
1
Bright
Sorry i want to learn more about this question
Bright
Someone help
Bright
a= 0.20233 b=0.3384
Sufiyan
a
Shaynaynay
How do I interpret level of significance?
Mohd Reply
It depends on your business problem or in Machine Learning you could use ROC- AUC cruve to decide the threshold value
Shivam
how skewness and kurtosis are used in statistics
Owen Reply
yes what is it
Taneeya
Got questions? Join the online conversation and get instant answers!
Jobilize.com Reply

Get Jobilize Job Search Mobile App in your pocket Now!

Get it on Google Play Download on the App Store Now


Source:  OpenStax, University physics volume 1. OpenStax CNX. Sep 19, 2016 Download for free at http://cnx.org/content/col12031/1.5
Google Play and the Google Play logo are trademarks of Google Inc.

Notification Switch

Would you like to follow the 'University physics volume 1' conversation and receive update notifications?

Ask