Calculate position vectors in a multidimensional displacement problem.
Solve for the displacement in two or three dimensions.
Calculate the velocity vector given the position vector as a function of time.
Calculate the average velocity in multiple dimensions.
Displacement and velocity in two or three dimensions are straightforward extensions of the one-dimensional definitions. However, now they are vector quantities, so calculations with them have to follow the rules of vector algebra, not scalar algebra.
Displacement vector
To describe motion in two and three dimensions, we must first establish a coordinate system and a convention for the axes. We generally use the coordinates
x ,
y , and
z to locate a particle at point
P (
x ,
y ,
z ) in three dimensions. If the particle is moving, the variables
x ,
y , and
z are functions of time (
t ):
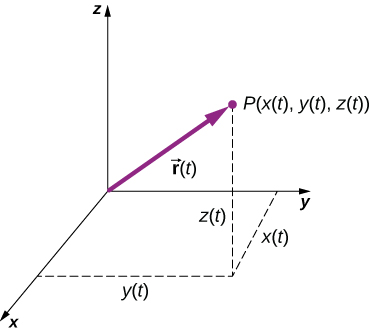
[link] shows the coordinate system and the vector to point
P , where a particle could be located at a particular time
t . Note the orientation of the
x ,
y , and
z axes. This orientation is called a right-handed coordinate system (
Coordinate Systems and Components of a Vector ) and it is used throughout the chapter.
A three-dimensional coordinate system with a particle at position
P (
x (
t ),
y (
t ),
z (
t )).
With our definition of the position of a particle in three-dimensional space, we can formulate the three-dimensional displacement.
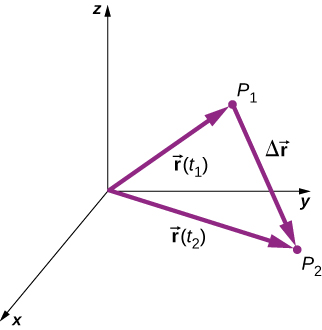
[link] shows a particle at time
located at
with position vector
At a later time
the particle is located at
with position vector
. The
displacement vector
is found by subtracting
from
Vector addition is discussed in
Vectors . Note that this is the same operation we did in one dimension, but now the vectors are in three-dimensional space.
The displacement
is the vector from
to
.
The following examples illustrate the concept of displacement in multiple dimensions.
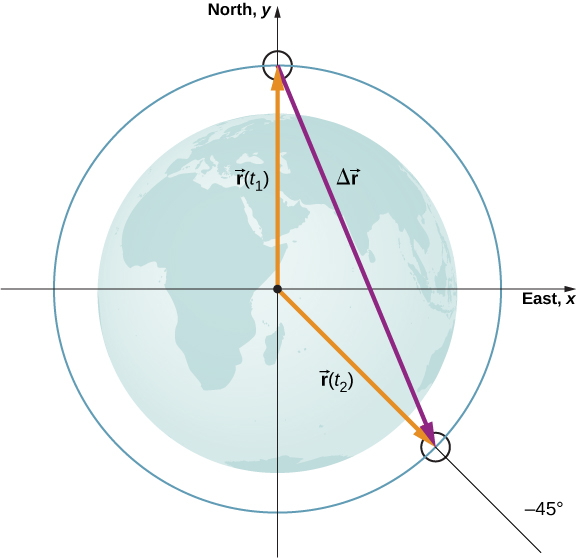
Polar orbiting satellite
A satellite is in a circular polar orbit around Earth at an altitude of 400 km—meaning, it passes directly overhead at the North and South Poles. What is the magnitude and direction of the displacement vector from when it is directly over the North Pole to when it is at
latitude?
Strategy
We make a picture of the problem to visualize the solution graphically. This will aid in our understanding of the displacement. We then use unit vectors to solve for the displacement.
Solution
[link] shows the surface of Earth and a circle that represents the orbit of the satellite. Although satellites are moving in three-dimensional space, they follow trajectories of ellipses, which can be graphed in two dimensions. The position vectors are drawn from the center of Earth, which we take to be the origin of the coordinate system, with the
y -axis as north and the
x -axis as east. The vector between them is the displacement of the satellite. We take the radius of Earth as 6370 km, so the length of each position vector is 6770 km.
Two position vectors are drawn from the center of Earth, which is the origin of the coordinate system, with the
y -axis as north and the
x -axis as east. The vector between them is the displacement of the satellite.
In economics, a perfect market refers to a theoretical construct where all participants have perfect information, goods are homogenous, there are no barriers to entry or exit, and prices are determined solely by supply and demand. It's an idealized model used for analysis,
When MP₁ becomes negative, TP start to decline.
Extuples Suppose that the short-run production function of certain cut-flower firm is given by: Q=4KL-0.6K2 - 0.112 •
Where is quantity of cut flower produced, I is labour input and K is fixed capital input (K-5). Determine the average product of lab
Kelo
Extuples Suppose that the short-run production function of certain cut-flower firm is given by: Q=4KL-0.6K2 - 0.112 •
Where is quantity of cut flower produced, I is labour input and K is fixed capital input (K-5). Determine the average product of labour (APL) and marginal product of labour (MPL)
Quantity demanded refers to the specific amount of a good or service that consumers are willing and able to purchase at a give price and within a specific time period. Demand, on the other hand, is a broader concept that encompasses the entire relationship between price and quantity demanded
Ezea
ok
Shukri
how do you save a country economic situation when it's falling apart
Economic growth as an increase in the production and consumption of goods and services within an economy.but
Economic development as a broader concept that encompasses not only economic growth but also social & human well being.
Shukri
production function means
Jabir
What do you think is more important to focus on when considering inequality ?
sir...I just want to ask one question... Define the term contract curve? if you are free please help me to find this answer 🙏
Asui
it is a curve that we get after connecting the pareto optimal combinations of two consumers after their mutually beneficial trade offs
Awais
thank you so much 👍 sir
Asui
In economics, the contract curve refers to the set of points in an Edgeworth box diagram where both parties involved in a trade cannot be made better off without making one of them worse off. It represents the Pareto efficient allocations of goods between two individuals or entities, where neither p
Cornelius
In economics, the contract curve refers to the set of points in an Edgeworth box diagram where both parties involved in a trade cannot be made better off without making one of them worse off. It represents the Pareto efficient allocations of goods between two individuals or entities,
Cornelius
Suppose a consumer consuming two commodities X and Y has
The following utility function u=X0.4 Y0.6. If the price of the X and Y are 2 and 3 respectively and income Constraint is birr 50.
A,Calculate quantities of x and y which maximize utility.
B,Calculate value of Lagrange multiplier.
C,Calculate quantities of X and Y consumed with a given price.
D,alculate optimum level of output .
the market for lemon has 10 potential consumers, each having an individual demand curve p=101-10Qi, where p is price in dollar's per cup and Qi is the number of cups demanded per week by the i th consumer.Find the market demand curve using algebra. Draw an individual demand curve and the market dema
suppose the production function is given by ( L, K)=L¼K¾.assuming capital is fixed find APL and MPL. consider the following short run production function:Q=6L²-0.4L³ a) find the value of L that maximizes output b)find the value of L that maximizes marginal product