<< Chapter < Page Chapter >> Page >
Photograph of an electric eel.
An electric eel flexes its muscles to create a voltage that stuns prey. (credit: chrisbb, Flickr)

Electrocardiograms

Just as nerve impulses are transmitted by depolarization and repolarization of adjacent membrane, the depolarization that causes muscle contraction can also stimulate adjacent muscle cells to depolarize (fire) and contract. Thus, a depolarization wave can be sent across the heart, coordinating its rhythmic contractions and enabling it to perform its vital function of propelling blood through the circulatory system. [link] is a simplified graphic of a depolarization wave spreading across the heart from the sinoarterial (SA) node , the heart's natural pacemaker.

The figure shows that the charge distribution on the outer surface of the heart changes from positive to negative during depolarization. This wave of depolarization, spreading from the upper right toward the lower left of the heart, is represented by a vector pointing in the direction of the wave. The components of this vector are measured by placing electrodes on the patient's chest. The figure shows three electrodes, labeled R A, L A, and L L, placed to form a triangle around the heart. The electrode R A is close to the right atrium, L A is close to the left atrium, and L L is just below the heart. R A and L A form a pair called lead one, R A and L L form a second pair called lead two, and L A and L L form a third pair called lead three. Each pair of electrodes measures a component of the depolarization vector.
The outer surface of the heart changes from positive to negative during depolarization. This wave of depolarization is spreading from the top of the heart and is represented by a vector pointing in the direction of the wave. This vector is a voltage (potential difference) vector. Three electrodes, labeled RA, LA, and LL, are placed on the patient. Each pair (called leads I, II, and III) measures a component of the depolarization vector and is graphed in an ECG.

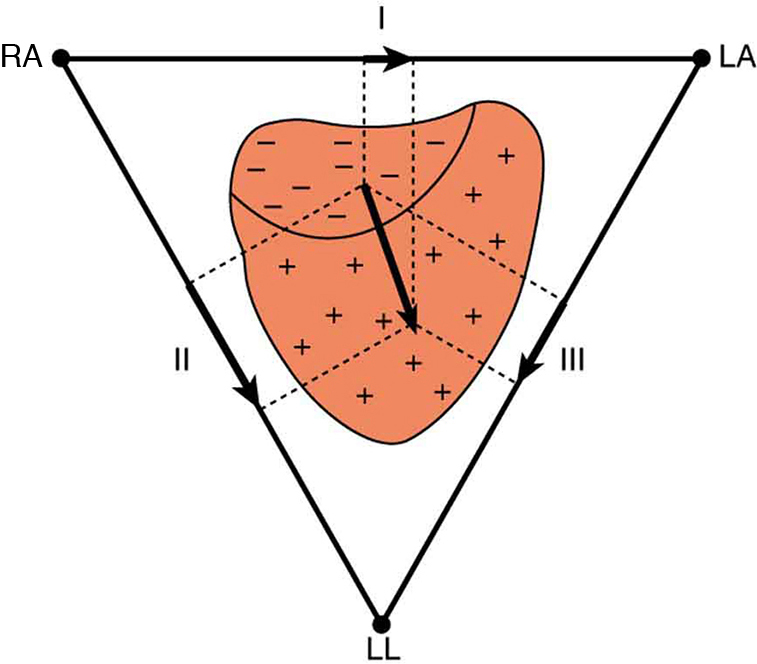
An electrocardiogram (ECG)    is a record of the voltages created by the wave of depolarization and subsequent repolarization in the heart. Voltages between pairs of electrodes placed on the chest are vector components of the voltage wave on the heart. Standard ECGs have 12 or more electrodes, but only three are shown in [link] for clarity. Decades ago, three-electrode ECGs were performed by placing electrodes on the left and right arms and the left leg. The voltage between the right arm and the left leg is called the lead II potential and is the most often graphed. We shall examine the lead II potential as an indicator of heart-muscle function and see that it is coordinated with arterial blood pressure as well.

Heart function and its four-chamber action are explored in Viscosity and Laminar Flow; Poiseuille's Law . Basically, the right and left atria receive blood from the body and lungs, respectively, and pump the blood into the ventricles. The right and left ventricles, in turn, pump blood through the lungs and the rest of the body, respectively. Depolarization of the heart muscle causes it to contract. After contraction it is repolarized to ready it for the next beat. The ECG measures components of depolarization and repolarization of the heart muscle and can yield significant information on the functioning and malfunctioning of the heart.

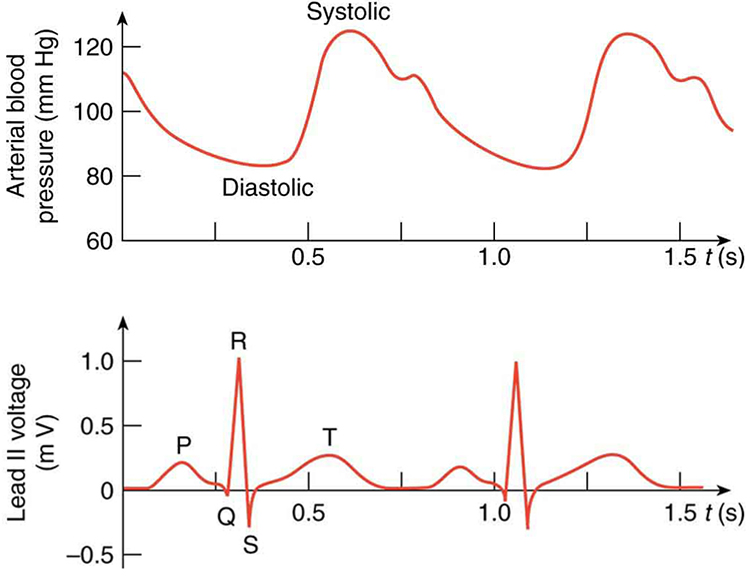
[link] shows an ECG of the lead II potential and a graph of the corresponding arterial blood pressure. The major features are labeled P, Q, R, S, and T. The P wave is generated by the depolarization and contraction of the atria as they pump blood into the ventricles. The QRS complex is created by the depolarization of the ventricles as they pump blood to the lungs and body. Since the shape of the heart and the path of the depolarization wave are not simple, the QRS complex has this typical shape and time span. The lead II QRS signal also masks the repolarization of the atria, which occur at the same time. Finally, the T wave is generated by the repolarization of the ventricles and is followed by the next P wave in the next heartbeat. Arterial blood pressure varies with each part of the heartbeat, with systolic (maximum) pressure occurring closely after the QRS complex, which signals contraction of the ventricles.

This figure has two graphs, placed one below the other. The lower graph shows an E C G of the lead two potential, and the upper graph shows the corresponding changes in arterial blood pressure. In each case, time is plotted on the horizontal axis, in seconds. The vertical axis of the upper graph shows the arterial blood pressure in millimeters of mercury, and the vertical axis of the lower graph shows the lead two voltage in millivolts. The upper graph is roughly sinusoidal, showing the diastolic or minimum blood pressure at about eighty millimeters of mercury, and the systolic or maximum blood pressure at about one hundred twenty millimeters of mercury. For the lower graph, the main features are labeled P, Q, R, S, and T. The P wave is a smooth curve that rises from zero millivolts to a peak of about zero point two five millivolts and falls to just below zero millivolts when it reaches point Q. From point Q to point R, the voltage rises steeply to about one millivolt, and then drops equally sharply to point S, at negative zero point three millivolts. This is followed by the T wave, which is a smooth curve, broader than the P wave, with a peak of comparable height. All of this is completed in less than seven-tenths of a second, with the voltage returning to zero millivolts. After about one-tenth of a second, the cycle begins again. The systolic blood pressure follows soon after the QRS complex.
A lead II ECG with corresponding arterial blood pressure. The QRS complex is created by the depolarization and contraction of the ventricles and is followed shortly by the maximum or systolic blood pressure. See text for further description.

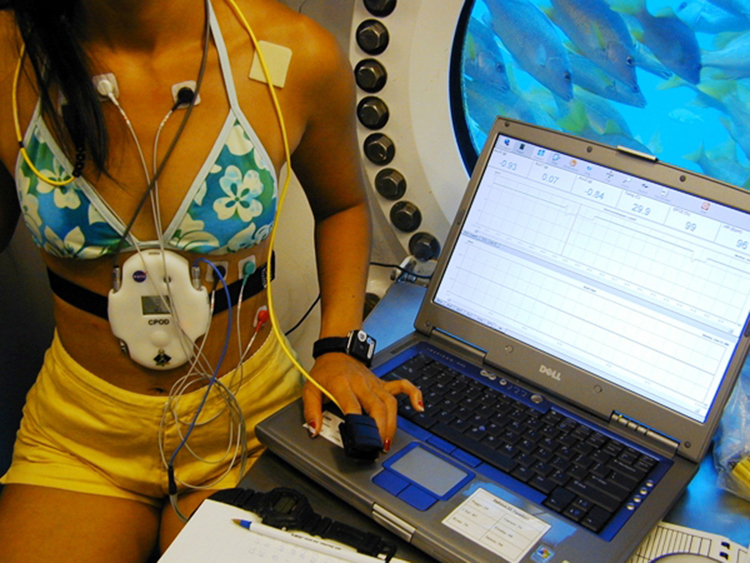
Taken together, the 12 leads of a state-of-the-art ECG can yield a wealth of information about the heart. For example, regions of damaged heart tissue, called infarcts, reflect electrical waves and are apparent in one or more lead potentials. Subtle changes due to slight or gradual damage to the heart are most readily detected by comparing a recent ECG to an older one. This is particularly the case since individual heart shape, size, and orientation can cause variations in ECGs from one individual to another. ECG technology has advanced to the point where a portable ECG monitor with a liquid crystal instant display and a printer can be carried to patients' homes or used in emergency vehicles. See [link] .

Photograph of a NASA scientist in an underwater habitat recording her vital signs using a portable device and a laptop computer.
This NASA scientist and NEEMO 5 aquanaut's heart rate and other vital signs are being recorded by a portable device while living in an underwater habitat. (credit: NASA, Life Sciences Data Archive at Johnson Space Center, Houston, Texas)

Phet explorations: neuron

Neuron

Stimulate a neuron and monitor what happens. Pause, rewind, and move forward in time in order to observe the ions as they move across the neuron membrane.

Section summary

  • Electric potentials in neurons and other cells are created by ionic concentration differences across semipermeable membranes.
  • Stimuli change the permeability and create action potentials that propagate along neurons.
  • Myelin sheaths speed this process and reduce the needed energy input.
  • This process in the heart can be measured with an electrocardiogram (ECG).

Conceptual questions

Note that in [link] , both the concentration gradient and the Coulomb force tend to move Na + size 12{"Na" rSup { size 8{+{}} } } {} ions into the cell. What prevents this?

Got questions? Get instant answers now!

Define depolarization, repolarization, and the action potential.

Got questions? Get instant answers now!

Explain the properties of myelinated nerves in terms of the insulating properties of myelin.

Got questions? Get instant answers now!

Problems&Exercises

Integrated Concepts

Use the ECG in [link] to determine the heart rate in beats per minute assuming a constant time between beats.

80 beats/minute

Got questions? Get instant answers now!

Integrated Concepts

(a) Referring to [link] , find the time systolic pressure lags behind the middle of the QRS complex. (b) Discuss the reasons for the time lag.

Got questions? Get instant answers now!

Questions & Answers

differentiate between demand and supply giving examples
Lambiv Reply
differentiated between demand and supply using examples
Lambiv
what is labour ?
Lambiv
how will I do?
Venny Reply
how is the graph works?I don't fully understand
Rezat Reply
information
Eliyee
devaluation
Eliyee
t
WARKISA
hi guys good evening to all
Lambiv
multiple choice question
Aster Reply
appreciation
Eliyee
explain perfect market
Lindiwe Reply
In economics, a perfect market refers to a theoretical construct where all participants have perfect information, goods are homogenous, there are no barriers to entry or exit, and prices are determined solely by supply and demand. It's an idealized model used for analysis,
Ezea
What is ceteris paribus?
Shukri Reply
other things being equal
AI-Robot
When MP₁ becomes negative, TP start to decline. Extuples Suppose that the short-run production function of certain cut-flower firm is given by: Q=4KL-0.6K2 - 0.112 • Where is quantity of cut flower produced, I is labour input and K is fixed capital input (K-5). Determine the average product of lab
Kelo
Extuples Suppose that the short-run production function of certain cut-flower firm is given by: Q=4KL-0.6K2 - 0.112 • Where is quantity of cut flower produced, I is labour input and K is fixed capital input (K-5). Determine the average product of labour (APL) and marginal product of labour (MPL)
Kelo
yes,thank you
Shukri
Can I ask you other question?
Shukri
what is monopoly mean?
Habtamu Reply
What is different between quantity demand and demand?
Shukri Reply
Quantity demanded refers to the specific amount of a good or service that consumers are willing and able to purchase at a give price and within a specific time period. Demand, on the other hand, is a broader concept that encompasses the entire relationship between price and quantity demanded
Ezea
ok
Shukri
how do you save a country economic situation when it's falling apart
Lilia Reply
what is the difference between economic growth and development
Fiker Reply
Economic growth as an increase in the production and consumption of goods and services within an economy.but Economic development as a broader concept that encompasses not only economic growth but also social & human well being.
Shukri
production function means
Jabir
What do you think is more important to focus on when considering inequality ?
Abdisa Reply
any question about economics?
Awais Reply
sir...I just want to ask one question... Define the term contract curve? if you are free please help me to find this answer 🙏
Asui
it is a curve that we get after connecting the pareto optimal combinations of two consumers after their mutually beneficial trade offs
Awais
thank you so much 👍 sir
Asui
In economics, the contract curve refers to the set of points in an Edgeworth box diagram where both parties involved in a trade cannot be made better off without making one of them worse off. It represents the Pareto efficient allocations of goods between two individuals or entities, where neither p
Cornelius
In economics, the contract curve refers to the set of points in an Edgeworth box diagram where both parties involved in a trade cannot be made better off without making one of them worse off. It represents the Pareto efficient allocations of goods between two individuals or entities,
Cornelius
Suppose a consumer consuming two commodities X and Y has The following utility function u=X0.4 Y0.6. If the price of the X and Y are 2 and 3 respectively and income Constraint is birr 50. A,Calculate quantities of x and y which maximize utility. B,Calculate value of Lagrange multiplier. C,Calculate quantities of X and Y consumed with a given price. D,alculate optimum level of output .
Feyisa Reply
Answer
Feyisa
c
Jabir
the market for lemon has 10 potential consumers, each having an individual demand curve p=101-10Qi, where p is price in dollar's per cup and Qi is the number of cups demanded per week by the i th consumer.Find the market demand curve using algebra. Draw an individual demand curve and the market dema
Gsbwnw Reply
suppose the production function is given by ( L, K)=L¼K¾.assuming capital is fixed find APL and MPL. consider the following short run production function:Q=6L²-0.4L³ a) find the value of L that maximizes output b)find the value of L that maximizes marginal product
Abdureman
types of unemployment
Yomi Reply
What is the difference between perfect competition and monopolistic competition?
Mohammed
Got questions? Join the online conversation and get instant answers!
Jobilize.com Reply
Practice Key Terms 4

Get Jobilize Job Search Mobile App in your pocket Now!

Get it on Google Play Download on the App Store Now


Source:  OpenStax, College physics for ap® courses. OpenStax CNX. Nov 04, 2016 Download for free at https://legacy.cnx.org/content/col11844/1.14
Google Play and the Google Play logo are trademarks of Google Inc.

Notification Switch

Would you like to follow the 'College physics for ap® courses' conversation and receive update notifications?

Ask