<< Chapter < Page Chapter >> Page >

Unlike histograms, many frequency polygons can be plotted together to compare several frequency distributions, provided that the data has been grouped in the same way and provide a clear way to compare multiple datasets.

Pie charts

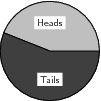
A pie chart is a graph that is used to show what categories make up a specific section of the data, and what the contribution each category makes to the entire set of data. A pie chart is based on a circle, and each category is represented as a wedge of the circle or alternatively as a slice of the pie. The area of each wedge is proportional to the ratio of that specific category to the total number of data values in the data set. The wedges are usually shown in different colours to make the distinction between the different categories easier.

Example of a pie chart for Data Set 1. Pie charts show what contribution each group makes to the total data set.

Method: Drawing a pie-chart

  1. Draw a circle that represents the entire data set.
  2. Calculate what proportion of 360   each category corresponds to according to
    Angular Size = Frequency Total × 360
  3. Draw a wedge corresponding to the angular contribution.
  4. Check that the total degrees for the different wedges adds up to close to 360 .

Draw a pie chart for Data Set 2 , showing the relative proportions of each data value to the total.

  1. Total
    Data Value 1 2 3 4 5 6
    Frequency 30 32 35 34 37 32 200
  2. Data Value Angular Size of Wedge
    1 Frequency Total × 360 = 30 200 × 360 = 54
    2 Frequency Total × 360 = 32 200 × 360 = 57 , 6
    3 Frequency Total × 360 = 35 200 × 360 = 63
    4 Frequency Total × 360 = 34 200 × 360 = 61 , 2
    5 Frequency Total × 360 = 37 200 × 360 = 66 , 6
    6 Frequency Total × 360 = 32 200 × 360 = 57 , 6

Note that the total angular size of the wedges may not add up to exactly 360   because of rounding.

Line and broken line graphs

All graphs that have been studied until this point (bar, compound bar, histogram, frequency polygon and pie) are drawn from grouped data. The graphs that will be studied in this section are drawn from the ungrouped or raw data.

Line and broken line graphs are plots of a dependent variable as a function of an independent variable, e.g. the average global temperature as a function of time, or the average rainfall in a country as a function of season.

Usually a line graph is plotted after a table has been provided showing the relationship between the two variables in the form of pairs. Just as in (x,y) graphs, each of the pairs results in a specific point on the graph, and being a line graph these points are connected to one another by a line.

Many other line graphs exist; they all connect the points by lines, not necessarily straight lines. Sometimes polynomials, for example, are used to describe approximately the basic relationship between the given pairs of variables, and between these points.

Example of a line graph for Data Set 5.

Clawde the cat is overweight and her owners have decided to put her on a restricted eating plan. Her mass is measured once a month and is tabulated below. Draw a line graph of the data to determine whether the restricted eating plan is working.

Month Mass (kg)
March 4,53
April 4,56
May 4,51
June 4,41
July 4,41
August 4,36
September 4,43
October 4,37
  1. We are required to plot a line graph to determine whether the restricted eating plan is helping Clawde the cat lose weight. We are given all the information that we need to plot the graph.

  2. There is a slight decrease of mass from March to October, so the restricted eating plan is working, but very slowly.

Exercises - graphical representation of data

  1. Represent the following information on a pie chart.
    Walk 15
    Cycle 24
    Train 18
    Bus 8
    Car 35
    Total 100
    Click here for the solution
  2. Represent the following information using a broken line graph.
    Time 07h00 08h00 09h00 10h00 11h00 12h00
    Temp ( C) 16 16,5 17 19 20 24
    Click here for the solution
  3. Represent the following information on a histogram. Using a coloured pen, draw a frequency polygon on this histogram.
    Time in seconds Frequency
    16 - 25 5
    26 - 35 10
    36 - 45 26
    46 - 55 30
    56 - 65 15
    66 - 75 12
    76 - 85 10
    Click here for the solution
  4. The maths marks of a class of 30 learners are given below, represent this information using a suitable graph.
    82 75 66 54 79 78 29 55 68 91
    43 48 90 61 45 60 82 63 72 53
    51 32 62 42 49 62 81 49 61 60
    Click here for the solution
  5. Use a compound bar graph to illustrate the following information
    Year 2003 2004 2005 2006 2007
    Girls 18 15 13 12 15
    Boys 15 11 18 16 10
    Click here for the solution

Questions & Answers

differentiate between demand and supply giving examples
Lambiv Reply
differentiated between demand and supply using examples
Lambiv
what is labour ?
Lambiv
how will I do?
Venny Reply
how is the graph works?I don't fully understand
Rezat Reply
information
Eliyee
devaluation
Eliyee
t
WARKISA
hi guys good evening to all
Lambiv
multiple choice question
Aster Reply
appreciation
Eliyee
explain perfect market
Lindiwe Reply
In economics, a perfect market refers to a theoretical construct where all participants have perfect information, goods are homogenous, there are no barriers to entry or exit, and prices are determined solely by supply and demand. It's an idealized model used for analysis,
Ezea
What is ceteris paribus?
Shukri Reply
other things being equal
AI-Robot
When MP₁ becomes negative, TP start to decline. Extuples Suppose that the short-run production function of certain cut-flower firm is given by: Q=4KL-0.6K2 - 0.112 • Where is quantity of cut flower produced, I is labour input and K is fixed capital input (K-5). Determine the average product of lab
Kelo
Extuples Suppose that the short-run production function of certain cut-flower firm is given by: Q=4KL-0.6K2 - 0.112 • Where is quantity of cut flower produced, I is labour input and K is fixed capital input (K-5). Determine the average product of labour (APL) and marginal product of labour (MPL)
Kelo
yes,thank you
Shukri
Can I ask you other question?
Shukri
what is monopoly mean?
Habtamu Reply
What is different between quantity demand and demand?
Shukri Reply
Quantity demanded refers to the specific amount of a good or service that consumers are willing and able to purchase at a give price and within a specific time period. Demand, on the other hand, is a broader concept that encompasses the entire relationship between price and quantity demanded
Ezea
ok
Shukri
how do you save a country economic situation when it's falling apart
Lilia Reply
what is the difference between economic growth and development
Fiker Reply
Economic growth as an increase in the production and consumption of goods and services within an economy.but Economic development as a broader concept that encompasses not only economic growth but also social & human well being.
Shukri
production function means
Jabir
What do you think is more important to focus on when considering inequality ?
Abdisa Reply
any question about economics?
Awais Reply
sir...I just want to ask one question... Define the term contract curve? if you are free please help me to find this answer 🙏
Asui
it is a curve that we get after connecting the pareto optimal combinations of two consumers after their mutually beneficial trade offs
Awais
thank you so much 👍 sir
Asui
In economics, the contract curve refers to the set of points in an Edgeworth box diagram where both parties involved in a trade cannot be made better off without making one of them worse off. It represents the Pareto efficient allocations of goods between two individuals or entities, where neither p
Cornelius
In economics, the contract curve refers to the set of points in an Edgeworth box diagram where both parties involved in a trade cannot be made better off without making one of them worse off. It represents the Pareto efficient allocations of goods between two individuals or entities,
Cornelius
Suppose a consumer consuming two commodities X and Y has The following utility function u=X0.4 Y0.6. If the price of the X and Y are 2 and 3 respectively and income Constraint is birr 50. A,Calculate quantities of x and y which maximize utility. B,Calculate value of Lagrange multiplier. C,Calculate quantities of X and Y consumed with a given price. D,alculate optimum level of output .
Feyisa Reply
Answer
Feyisa
c
Jabir
the market for lemon has 10 potential consumers, each having an individual demand curve p=101-10Qi, where p is price in dollar's per cup and Qi is the number of cups demanded per week by the i th consumer.Find the market demand curve using algebra. Draw an individual demand curve and the market dema
Gsbwnw Reply
suppose the production function is given by ( L, K)=L¼K¾.assuming capital is fixed find APL and MPL. consider the following short run production function:Q=6L²-0.4L³ a) find the value of L that maximizes output b)find the value of L that maximizes marginal product
Abdureman
types of unemployment
Yomi Reply
What is the difference between perfect competition and monopolistic competition?
Mohammed
Got questions? Join the online conversation and get instant answers!
Jobilize.com Reply

Get Jobilize Job Search Mobile App in your pocket Now!

Get it on Google Play Download on the App Store Now


Source:  OpenStax, Siyavula textbooks: grade 10 maths [ncs]. OpenStax CNX. Aug 05, 2011 Download for free at http://cnx.org/content/col11239/1.2
Google Play and the Google Play logo are trademarks of Google Inc.

Notification Switch

Would you like to follow the 'Siyavula textbooks: grade 10 maths [ncs]' conversation and receive update notifications?

Ask