<< Chapter < Page Chapter >> Page >

By the end of this section, you will be able to:

  • Evaluate the reasons for making intertemporal choices
  • Interpret an intertemporal budget constraint
  • Analyze why people in America tend to save such a small percentage of their income

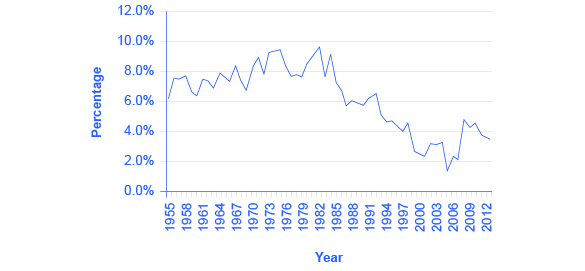
Rates of saving in America have never been especially high, but they seem to have dipped even lower in recent years, as the data from the Bureau of Economic Analysis in [link] show. A decision about how much to save can be represented using an intertemporal budget constraint . Household decisions about the quantity of financial savings show the same underlying pattern of logic as the consumption choice decision and the labor-leisure decision.

Personal savings as a percentage of personal income

The graph shows that since the 1980s, people have begun to save much less of their earnings. In 1982, the percentage of income being saved was just less than 10%. In 2012, the percentage of income being saved was less than 4%.
Personal savings were about 7 to 11% of personal income for most of the years from the late 1950s up to the early 1990s. Since then, the rate of personal savings has fallen substantially, although it seems to have bounced back a bit since 2008. (Source: http://www.bea.gov/newsreleases/national/pi/pinewsrelease.htm)

The discussion of financial saving here will not focus on the specific financial investment choices, like bank accounts, stocks, bonds, mutual funds, or owning a house or gold coins. The characteristics of these specific financial investments, along with the risks and tradeoffs they pose, are detailed in the Labor and Financial Markets chapter. Here, the focus is saving in total—that is, on how a household determines how much to consume in the present and how much to save, given the expected rate of return (or interest rate), and how the quantity of saving alters when the rate of return changes.

Using marginal utility to make intertemporal choices

Savings behavior varies considerably across households. One factor is that households with higher incomes tend to save a larger percentage of their income. This pattern makes intuitive sense; a well-to-do family has the flexibility in its budget to save 20–25% of income, while a poor family struggling to keep food on the table will find it harder to put money aside.

Another factor that causes personal saving to vary is personal preferences. Some people may prefer to consume more now, and let the future look after itself. Others may wish to enjoy a lavish retirement, complete with expensive vacations, or to pile up money that they can pass along to their grandchildren. There are savers and spendthrifts among the young, middle-aged, and old, and among those with high, middle, and low income levels.

Consider this example: Yelberton is a young man starting off at his first job. He thinks of the “present” as his working life and the “future” as after retirement. Yelberton’s plan is to save money from ages 30 to 60, retire at age 60, and then live off his retirement money from ages 60 to 85. On average, therefore, he will be saving for 30 years. If the rate of return that he can receive is 6% per year, then $1 saved in the present would build up to $5.74 after 30 years (using the formula for compound interest, $1(1 + 0.06) 30 = $5.74). Say that Yelberton will earn $1,000,000 over the 30 years from age 30 to age 60 (this amount is approximately an annual salary of $33,333 multiplied by 30 years). The question for Yelberton is how much of those lifetime earnings to consume during his working life, and how much to put aside until after retirement. This example is obviously built on simplifying assumptions, but it does convey the basic life-cycle choice of saving during working life for future consumption after retirement.

Questions & Answers

how do you get the 2/50
Abba Reply
number of sport play by 50 student construct discrete data
Aminu Reply
width of the frangebany leaves on how to write a introduction
Theresa Reply
Solve the mean of variance
Veronica Reply
Step 1: Find the mean. To find the mean, add up all the scores, then divide them by the number of scores. ... Step 2: Find each score's deviation from the mean. ... Step 3: Square each deviation from the mean. ... Step 4: Find the sum of squares. ... Step 5: Divide the sum of squares by n – 1 or N.
kenneth
what is error
Yakuba Reply
Is mistake done to something
Vutshila
Hy
anas
hy
What is the life teble
anas
hy
Jibrin
statistics is the analyzing of data
Tajudeen Reply
what is statics?
Zelalem Reply
how do you calculate mean
Gloria Reply
diveving the sum if all values
Shaynaynay
let A1,A2 and A3 events be independent,show that (A1)^c, (A2)^c and (A3)^c are independent?
Fisaye Reply
what is statistics
Akhisani Reply
data collected all over the world
Shaynaynay
construct a less than and more than table
Imad Reply
The sample of 16 students is taken. The average age in the sample was 22 years with astandard deviation of 6 years. Construct a 95% confidence interval for the age of the population.
Aschalew Reply
Bhartdarshan' is an internet-based travel agency wherein customer can see videos of the cities they plant to visit. The number of hits daily is a normally distributed random variable with a mean of 10,000 and a standard deviation of 2,400 a. what is the probability of getting more than 12,000 hits? b. what is the probability of getting fewer than 9,000 hits?
Akshay Reply
Bhartdarshan'is an internet-based travel agency wherein customer can see videos of the cities they plan to visit. The number of hits daily is a normally distributed random variable with a mean of 10,000 and a standard deviation of 2,400. a. What is the probability of getting more than 12,000 hits
Akshay
1
Bright
Sorry i want to learn more about this question
Bright
Someone help
Bright
a= 0.20233 b=0.3384
Sufiyan
a
Shaynaynay
How do I interpret level of significance?
Mohd Reply
It depends on your business problem or in Machine Learning you could use ROC- AUC cruve to decide the threshold value
Shivam
how skewness and kurtosis are used in statistics
Owen Reply
yes what is it
Taneeya
Got questions? Join the online conversation and get instant answers!
Jobilize.com Reply

Get Jobilize Job Search Mobile App in your pocket Now!

Get it on Google Play Download on the App Store Now


Source:  OpenStax, Principles of economics. OpenStax CNX. Sep 19, 2014 Download for free at http://legacy.cnx.org/content/col11613/1.11
Google Play and the Google Play logo are trademarks of Google Inc.

Notification Switch

Would you like to follow the 'Principles of economics' conversation and receive update notifications?

Ask