<< Chapter < Page Chapter >> Page >
Sharks set themselves apart in the animal kingdom in many ways, including segregation within their social groups. Two types of segregation have been identified in sharks: size segregation and social segregation. Cooperative hunting and protection in numbers are given as two plausible reasons why size segregation occurs, however evidence only partially supports the protection suggestion. Overall, size segregation has been found to occur because body size affects diet; as a result, sharks of similar sizes happen to aggregate in the same feeding areas. Five different hypotheses exist to explain social segregation: predation-risk (reproductive strategy) hypothesis, forage selection (sexual dimorphism-body-size) hypothesis, activity budget (body-size dimorphism) hypothesis, thermal niche-fecundity hypothesis, and social factors (social preference and social avoidance). Forage selection hypothesis and thermal niche-fecundity hypothesis are the two most supported hypotheses since both affect sexually dimorphic and monomorphic organisms. It can be concluded that segregation in sharks occurs as a result of defensive behaviors these elasmobranches practice in order to reduce reproductive loss rather than maximize reproductive benefits.

Author: Rui Zheng

Introduction

One of the most widely found forms of group behavior is social grouping (Conradt, 1998); animals of social species often divide themselves into groups of specific size or sex. Thus it's not surprising when sharks and other elasmobranches were observed to practice size segregation and social segregation . A common misconception is that sharks are solitary animals (Conradt, 1998); after evolving for the past 350-400 million years, alongside the 24,000 different species of bony fish and 900 different species of cartilaginous fish, sharks have not only evolved heightened predatory instincts towards scavenging fish and other invertebrates, they have also developed relatively large brains with complex structures (Compagno, 1984 and Long&Jones, 1996 as cited in Sims, 2003) as well more efficient social groupings.

This chapter will cover the different reasons why size and social segregation occur in different shark species. It will examine the limitations of the two suggested reasons for why size-specific groups are naturally selected for (increased hunting efficiency and increased protection) and the five hypotheses for social segregation: predation-risk (reproductive strategy) hypothesis, forage selection (sexual dimorphism-body-size) hypothesis, activity budget (body-size dimorphism) hypothesis, thermal niche-fecundity hypothesis, and social factors (social preference and social avoidance) hypothesis (Guttridge et al. 2009)(Wearmouth&Sims, 2008).

Grouping behavior

Grouping is a common behavior observed in many species of animals (Alexander, 1974). Groups can consist of unrelated individuals, uniformly related individuals that aren't siblings, close relatives, siblings, and genetically identical individuals. Depending on the relationship between the individuals that form the groups, the nature and significance of the groups differ; however all groups share one main goal: increasing the fitness of the participating members despite intrinsic interest conflicts. Overall, the benefits of grouping behaviors increase the fitness of the participating organism in spite of universal detriments. While increased competition for shared resources, increased transmission of diseases and parasites, and more conspicuous to predators may lower overall fitness, lowered chances of being predated due to either group defense or larger numbers and increased efficiency at securing resources, such as food and territory, increase participants’ overall fitness (Alexander, 1974).

There are two main subcategories of grouping behavior: aggregations and social groups (Alexander, 1974). The main difference lies in the reason for gathering. Aggregations of animals form when organisms gather due to a specific resource within a specific area. The members of these groups gain no fitness from cooperating from each other. Meanwhile, social groups form because the individuals gain from the actions and general presence of other members (Alexander, 1974).

Many animals gathered around a watering hole. lions in a pride.
Right An example of aggregation where the animals gathered due to the water. Left An example of a social group; the lions form a pride in order to increase direct fitness.
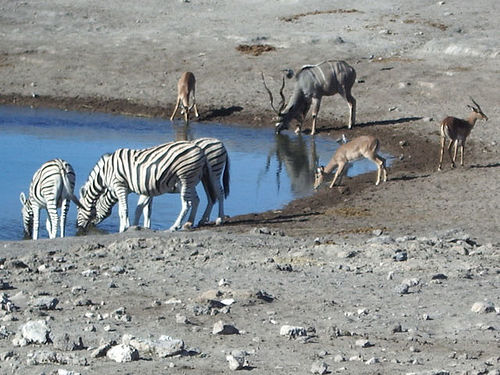
Image on the left from http://www.flickr.com/photos/98334721@N00/25901056.
Image on the right from http://www.flickr.com/photos/aggleton/2117753340/.

Questions & Answers

What are the factors that affect demand for a commodity
Florence Reply
differentiate between demand and supply giving examples
Lambiv Reply
differentiated between demand and supply using examples
Lambiv
what is labour ?
Lambiv
how will I do?
Venny Reply
how is the graph works?I don't fully understand
Rezat Reply
information
Eliyee
devaluation
Eliyee
t
WARKISA
hi guys good evening to all
Lambiv
multiple choice question
Aster Reply
appreciation
Eliyee
explain perfect market
Lindiwe Reply
In economics, a perfect market refers to a theoretical construct where all participants have perfect information, goods are homogenous, there are no barriers to entry or exit, and prices are determined solely by supply and demand. It's an idealized model used for analysis,
Ezea
What is ceteris paribus?
Shukri Reply
other things being equal
AI-Robot
When MP₁ becomes negative, TP start to decline. Extuples Suppose that the short-run production function of certain cut-flower firm is given by: Q=4KL-0.6K2 - 0.112 • Where is quantity of cut flower produced, I is labour input and K is fixed capital input (K-5). Determine the average product of lab
Kelo
Extuples Suppose that the short-run production function of certain cut-flower firm is given by: Q=4KL-0.6K2 - 0.112 • Where is quantity of cut flower produced, I is labour input and K is fixed capital input (K-5). Determine the average product of labour (APL) and marginal product of labour (MPL)
Kelo
yes,thank you
Shukri
Can I ask you other question?
Shukri
what is monopoly mean?
Habtamu Reply
What is different between quantity demand and demand?
Shukri Reply
Quantity demanded refers to the specific amount of a good or service that consumers are willing and able to purchase at a give price and within a specific time period. Demand, on the other hand, is a broader concept that encompasses the entire relationship between price and quantity demanded
Ezea
ok
Shukri
how do you save a country economic situation when it's falling apart
Lilia Reply
what is the difference between economic growth and development
Fiker Reply
Economic growth as an increase in the production and consumption of goods and services within an economy.but Economic development as a broader concept that encompasses not only economic growth but also social & human well being.
Shukri
production function means
Jabir
What do you think is more important to focus on when considering inequality ?
Abdisa Reply
any question about economics?
Awais Reply
sir...I just want to ask one question... Define the term contract curve? if you are free please help me to find this answer 🙏
Asui
it is a curve that we get after connecting the pareto optimal combinations of two consumers after their mutually beneficial trade offs
Awais
thank you so much 👍 sir
Asui
In economics, the contract curve refers to the set of points in an Edgeworth box diagram where both parties involved in a trade cannot be made better off without making one of them worse off. It represents the Pareto efficient allocations of goods between two individuals or entities, where neither p
Cornelius
In economics, the contract curve refers to the set of points in an Edgeworth box diagram where both parties involved in a trade cannot be made better off without making one of them worse off. It represents the Pareto efficient allocations of goods between two individuals or entities,
Cornelius
Suppose a consumer consuming two commodities X and Y has The following utility function u=X0.4 Y0.6. If the price of the X and Y are 2 and 3 respectively and income Constraint is birr 50. A,Calculate quantities of x and y which maximize utility. B,Calculate value of Lagrange multiplier. C,Calculate quantities of X and Y consumed with a given price. D,alculate optimum level of output .
Feyisa Reply
Answer
Feyisa
c
Jabir
the market for lemon has 10 potential consumers, each having an individual demand curve p=101-10Qi, where p is price in dollar's per cup and Qi is the number of cups demanded per week by the i th consumer.Find the market demand curve using algebra. Draw an individual demand curve and the market dema
Gsbwnw Reply
suppose the production function is given by ( L, K)=L¼K¾.assuming capital is fixed find APL and MPL. consider the following short run production function:Q=6L²-0.4L³ a) find the value of L that maximizes output b)find the value of L that maximizes marginal product
Abdureman
Got questions? Join the online conversation and get instant answers!
Jobilize.com Reply

Get Jobilize Job Search Mobile App in your pocket Now!

Get it on Google Play Download on the App Store Now


Source:  OpenStax, Mockingbird tales: readings in animal behavior. OpenStax CNX. Jan 12, 2011 Download for free at http://cnx.org/content/col11211/1.5
Google Play and the Google Play logo are trademarks of Google Inc.

Notification Switch

Would you like to follow the 'Mockingbird tales: readings in animal behavior' conversation and receive update notifications?

Ask