<< Chapter < Page Chapter >> Page >

The teacher will assign one street block to every two learners. Learners must then fill in the details regarding the use of land on a table similar to the one on the previous page. Learners are also expected to draw a rough map of their area. If possible, it should also show the respective numbers of the plots.

IMPORTANT : Don’t walk about on your own in an unsafe area. Stay in a group. Teachers must ensure that learners don’t find themselves in areas which might be unsafe.

assignments for groupwork :

Hand in your work sheets containing the data, as well as a neat map depicting that part of the rural area where your survey was made.

3. Urban services

The bigger the town or city, the more services are usually found. As more people live in cities, more services are needed. For any business to be profitable, there has to be a minimum number of persons to support such a business. A pharmacy depends on at least 2 000 customers to survive. Certain services, however, are available in all cities, for example post offices, while other services are only available in some cities, for instance universities.

Urban services fall in different categories, such as:

a) Public services such as libraries, magistrate’s offices, hospitals, police stations, schools and churches.

b) Financial and professional services, such as medical practitioners, dentists, veterinary surgeons, attorneys, banks and insurance companies.

Commercial enterprises such as pharmacies, jewellers, furnishers, outfitters and bakeries, as well as butchers and car dealers.

4. Urban problems

Cities experience a variety of problems due to factors such as a rapid increase of residents, that put a strain on resources. The following problems are generally found in most cities:

a) Traffic problems due to the large number of residents who are road users.

b) Pollution due to gases emitted by factories and cars.

  1. Strain on agricultural land bordering on the outskirts of the city due to the demand

for land development.

d) Deterioration of buildings in the CBD due to age and a lack of maintenance.

5. The impact of human activities on the environment

Activity 3:

To identify problems and find the right solutions

[lo 2.3]

Study the following illustration and answer the questions that follow:

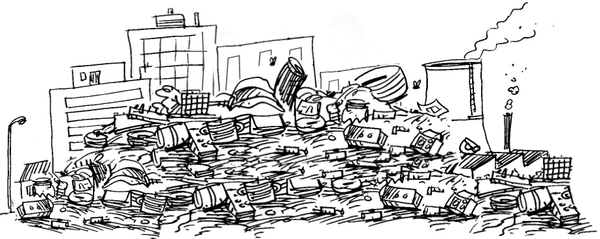
1. What serious problem do residents of this city face?

2. Which steps could be taken to improve or prevent the situation?

3. In what way could recycling contribute to relieve the strain of human waste on the environment?

4. What will happen if the human race continues to pollute the earth’s environment, air and water resources?

Further assignments for group work :

Find more information on the following forms of pollution:

  1. Air pollution
  2. Water pollution
  3. Soil pollution

Assessment

Learning Outcomes(LOs)
LO 1
Geographical EnquiryThe learner will be able to use enquiry skills to investigate geographical and environmental concepts and processes.
Assessment Standards(ASs)
This is seen when the learner:
1.2 interprets information from maps and atlases and from graphic and statististical
1.5 identifies and records information in the specific field [working with sources];
1.7 in various ways reports knowledge obtained during the study by formulating an argument based on information found; uses maps, diagrams and graphics; uses, where possible, computers in the presentation [putting the answer across].
LO 2
GEOGRAPHICAL KNOWLEDGE ANDUNDERSTANDINGThe learner will be able to demonstrategeographical and environmentalknowledge and understanding.
This is clear when the learner:
2.1 identifies and compares various kinds of settlement patterns [people and places];
  1. identifies factors that influence the formation of settlement patterns (natural, economic, social/ political) [people and resources];
2.3 identifies crucial factors leading to changes in settlement patterns in South Africa, Africa and elsewhere [people and environment].

Memorandum

ACTIVITY 1

  1. More or less in the middle. Always in the most accessible part of the urban area.
  2. Low-income housing area. This is an informal settlement area, in other words a squatter area. B is also adjacent to an industrial area, which makes it highly unsuitable for high-income housing.
  3. Industries.
  4. No provision was made for sport facilities.

ACTIVITY 2

Answer according to the area where you live.

ACTIVITY 3

  1. Pollution. The lack of refuse removal as a basic survive is the underlying problem.
  2. Providing more and free rubbish bins and big refuse containers. Launching educational programs in the community.

Factories in the distance (on the diagram) can be forced by means of legislation to install filters in chimneys for combating pollution.

  1. Very important role. Recycling containers can be placed on strategic points. Separate containers (clearly marked) for paper, glass and tins.
  2. The destruction of the environment will increase to such an extent that future generations will not be able to enjoy the same quality of life as present generations. May lead to an outbreak of diseases and epidemics.

Questions & Answers

differentiate between demand and supply giving examples
Lambiv Reply
differentiated between demand and supply using examples
Lambiv
what is labour ?
Lambiv
how will I do?
Venny Reply
how is the graph works?I don't fully understand
Rezat Reply
information
Eliyee
devaluation
Eliyee
t
WARKISA
hi guys good evening to all
Lambiv
multiple choice question
Aster Reply
appreciation
Eliyee
explain perfect market
Lindiwe Reply
In economics, a perfect market refers to a theoretical construct where all participants have perfect information, goods are homogenous, there are no barriers to entry or exit, and prices are determined solely by supply and demand. It's an idealized model used for analysis,
Ezea
What is ceteris paribus?
Shukri Reply
other things being equal
AI-Robot
When MP₁ becomes negative, TP start to decline. Extuples Suppose that the short-run production function of certain cut-flower firm is given by: Q=4KL-0.6K2 - 0.112 • Where is quantity of cut flower produced, I is labour input and K is fixed capital input (K-5). Determine the average product of lab
Kelo
Extuples Suppose that the short-run production function of certain cut-flower firm is given by: Q=4KL-0.6K2 - 0.112 • Where is quantity of cut flower produced, I is labour input and K is fixed capital input (K-5). Determine the average product of labour (APL) and marginal product of labour (MPL)
Kelo
yes,thank you
Shukri
Can I ask you other question?
Shukri
what is monopoly mean?
Habtamu Reply
What is different between quantity demand and demand?
Shukri Reply
Quantity demanded refers to the specific amount of a good or service that consumers are willing and able to purchase at a give price and within a specific time period. Demand, on the other hand, is a broader concept that encompasses the entire relationship between price and quantity demanded
Ezea
ok
Shukri
how do you save a country economic situation when it's falling apart
Lilia Reply
what is the difference between economic growth and development
Fiker Reply
Economic growth as an increase in the production and consumption of goods and services within an economy.but Economic development as a broader concept that encompasses not only economic growth but also social & human well being.
Shukri
production function means
Jabir
What do you think is more important to focus on when considering inequality ?
Abdisa Reply
any question about economics?
Awais Reply
sir...I just want to ask one question... Define the term contract curve? if you are free please help me to find this answer 🙏
Asui
it is a curve that we get after connecting the pareto optimal combinations of two consumers after their mutually beneficial trade offs
Awais
thank you so much 👍 sir
Asui
In economics, the contract curve refers to the set of points in an Edgeworth box diagram where both parties involved in a trade cannot be made better off without making one of them worse off. It represents the Pareto efficient allocations of goods between two individuals or entities, where neither p
Cornelius
In economics, the contract curve refers to the set of points in an Edgeworth box diagram where both parties involved in a trade cannot be made better off without making one of them worse off. It represents the Pareto efficient allocations of goods between two individuals or entities,
Cornelius
Suppose a consumer consuming two commodities X and Y has The following utility function u=X0.4 Y0.6. If the price of the X and Y are 2 and 3 respectively and income Constraint is birr 50. A,Calculate quantities of x and y which maximize utility. B,Calculate value of Lagrange multiplier. C,Calculate quantities of X and Y consumed with a given price. D,alculate optimum level of output .
Feyisa Reply
Answer
Feyisa
c
Jabir
the market for lemon has 10 potential consumers, each having an individual demand curve p=101-10Qi, where p is price in dollar's per cup and Qi is the number of cups demanded per week by the i th consumer.Find the market demand curve using algebra. Draw an individual demand curve and the market dema
Gsbwnw Reply
suppose the production function is given by ( L, K)=L¼K¾.assuming capital is fixed find APL and MPL. consider the following short run production function:Q=6L²-0.4L³ a) find the value of L that maximizes output b)find the value of L that maximizes marginal product
Abdureman
types of unemployment
Yomi Reply
What is the difference between perfect competition and monopolistic competition?
Mohammed
Got questions? Join the online conversation and get instant answers!
Jobilize.com Reply

Get Jobilize Job Search Mobile App in your pocket Now!

Get it on Google Play Download on the App Store Now


Source:  OpenStax, Geography grade 8. OpenStax CNX. Sep 11, 2009 Download for free at http://cnx.org/content/col11036/1.1
Google Play and the Google Play logo are trademarks of Google Inc.

Notification Switch

Would you like to follow the 'Geography grade 8' conversation and receive update notifications?

Ask