<< Chapter < Page Chapter >> Page >

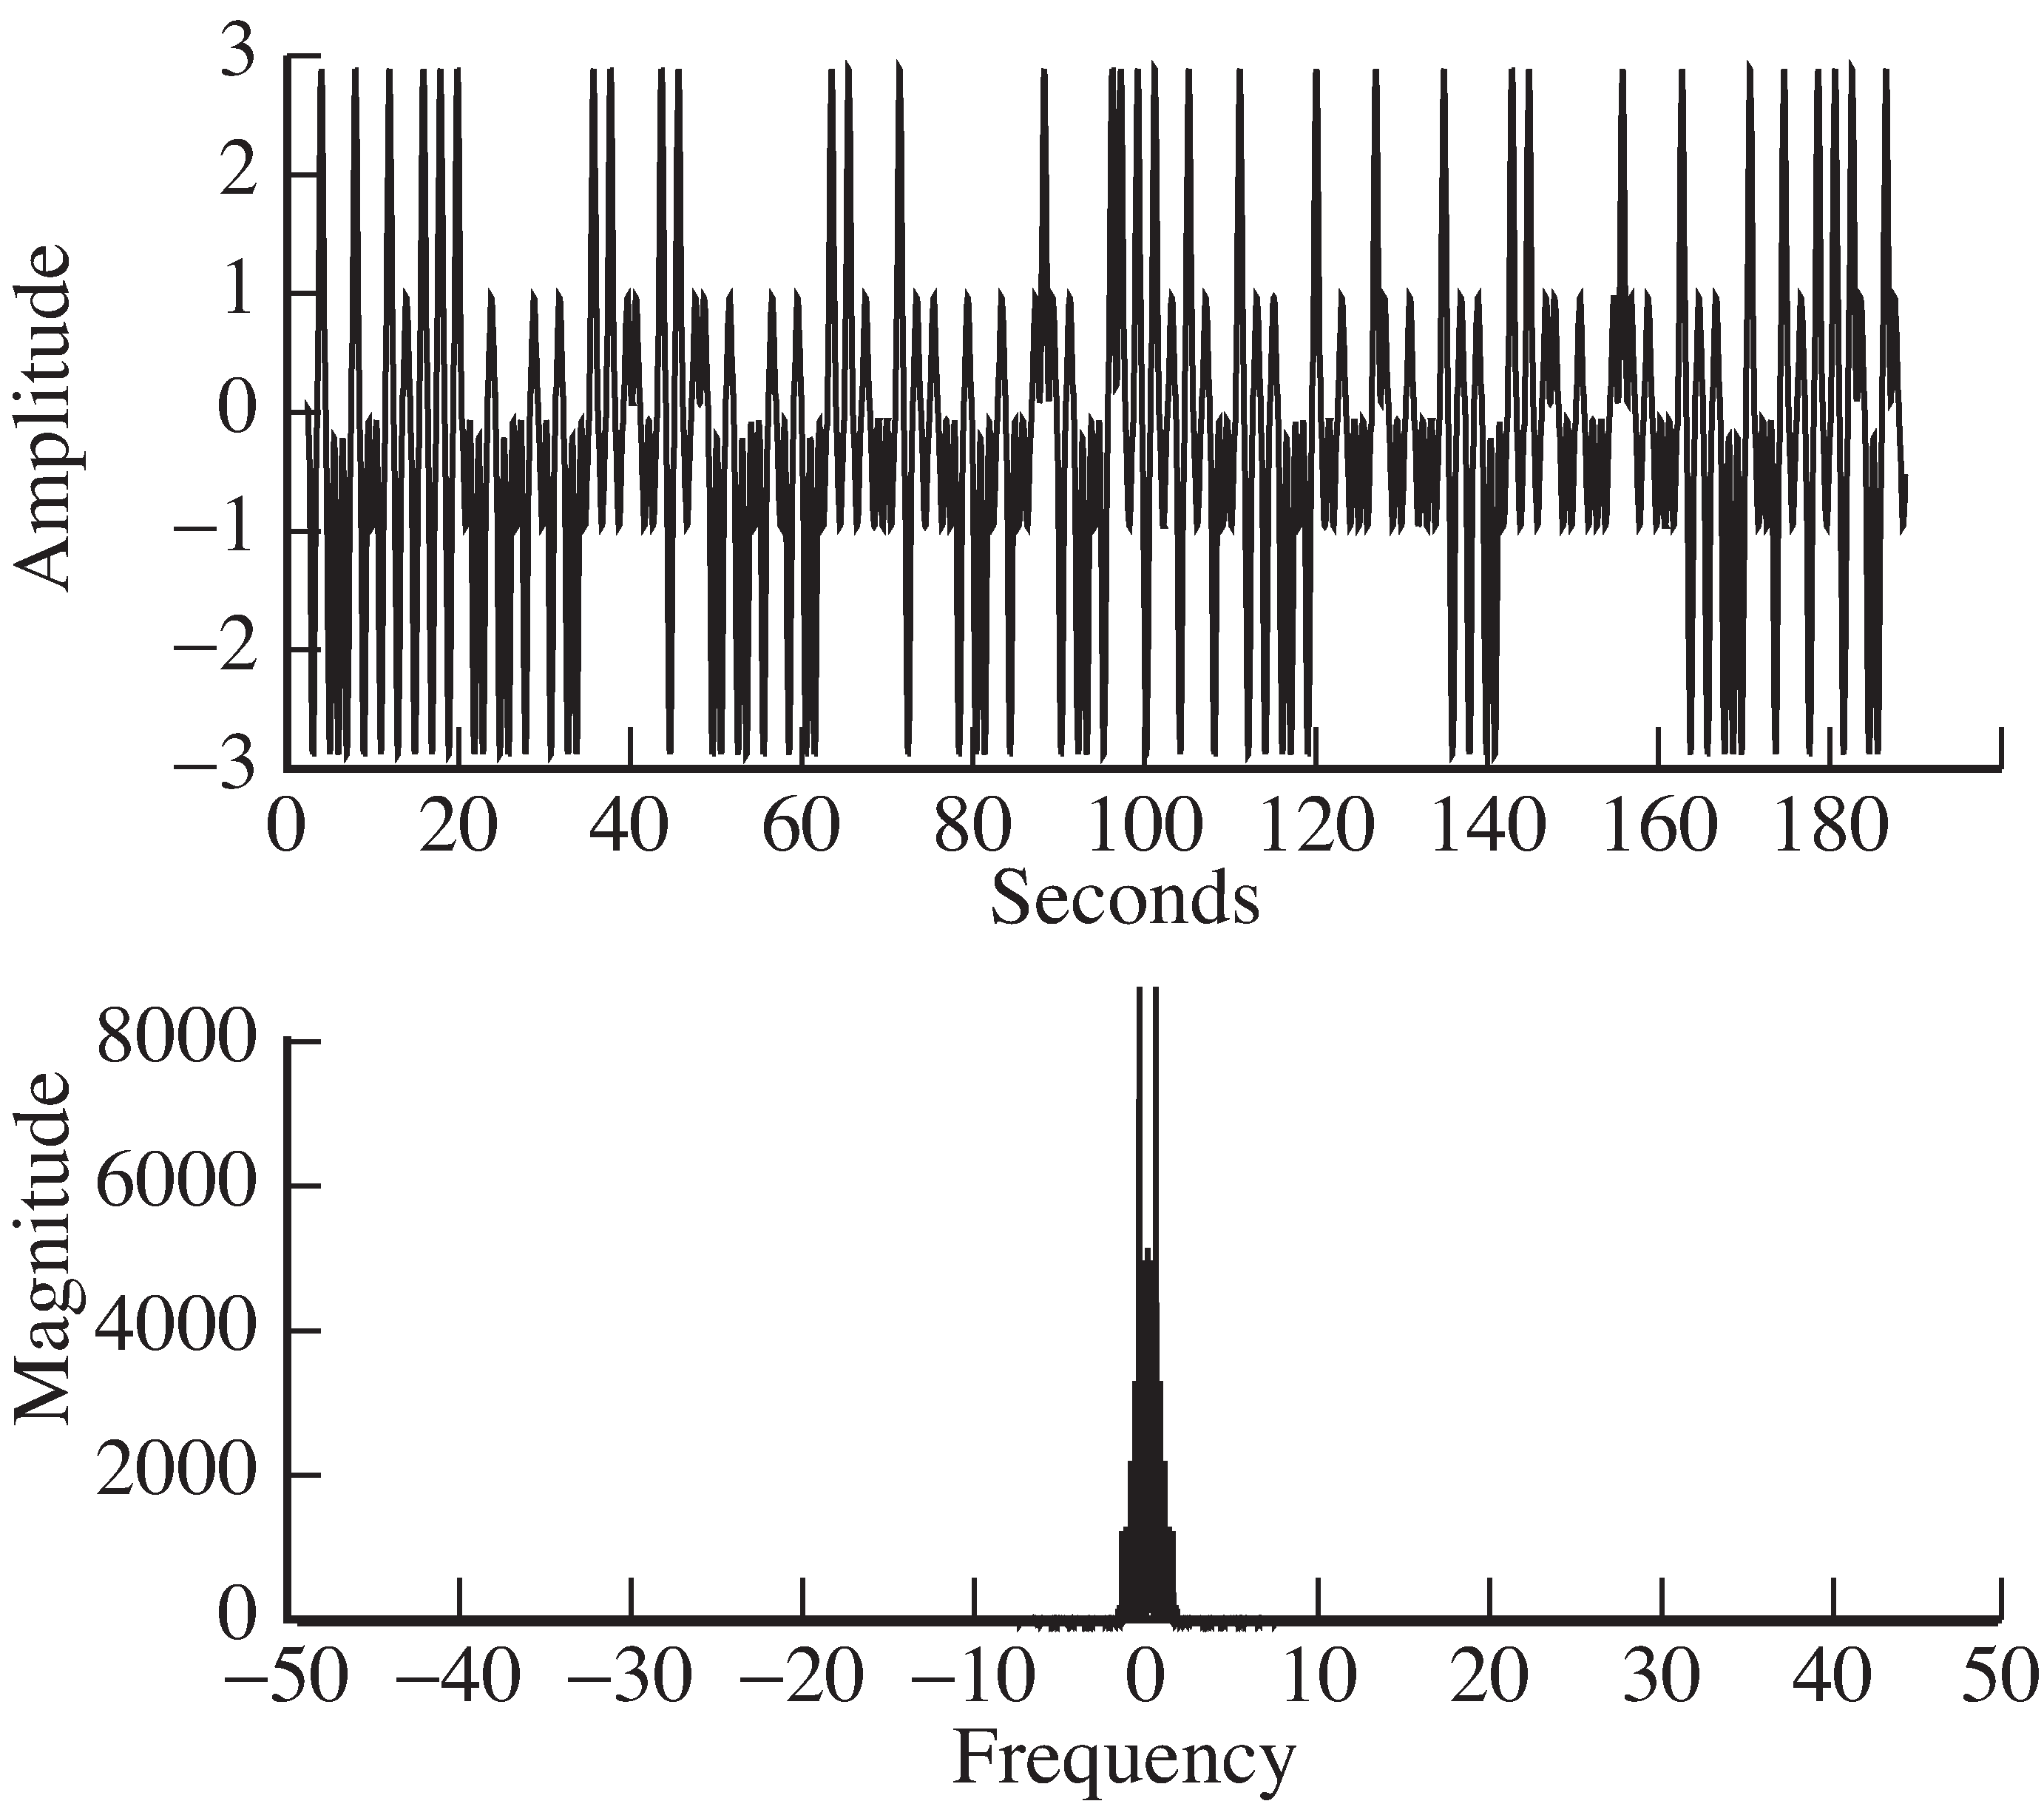
The output of the lowpass filter in the demodulator is a signal with the spectrum shownin [link] (drawn using plotspec(x3,1/M) ). The spectrum in [link] should compare quite closely tothat of the transmitter baseband in [link] , as indeed it does.It is easy to check the effectiveness of the lowpass filter design by attempting to use a variety of different lowpassfilters, as suggested in [link] .

Recall the discussion in [link] of matching two scaled pulse shapes.Viewing the pulse shape as a kind of marker, it is reasonable to correlate the pulse shape with the received signal in orderto locate the pulses. (More justification for this procedure is forthcoming in Chapter [link] .) This appears in [link] as the block labelled “pulse correlation filter.”The code in idsys.m implements this using the filter command to carry out the correlation (rather than the xcorr function), though the choice was a matter of convenience.(Refer to corrvsconv.m in Exercise  [link] to see how the two functions are related.)

The first 4 M samples of the resulting signal y are plotted in [link] (via plot(y(1:4*M)) ). The first three symbols of the message (i.e.,  m(1:3) ) are - 3 , 3, and - 3 , and [link] shows why it is best to take the samples at indices 125 + k M . The initial delay of 125 corresponds to half the length of the lowpass filter( 0.5*fl ) plus half the length of the correlator filter ( 0.5*M ) plus half a symbol period ( 0.5*M ), which accounts for the delay from the start of each pulse to its peak.

After demodulation and lowpass filtering, the signal x3  in idsys.m  is approximately the same as the the baseband transmitted signal (and spectrum) in Figure 9-2.
After demodulation and lowpass filtering, the signal x3 in idsys.mis approximately the same as the the baseband transmitted signal (and spectrum) in [link] .
The first four symbol periods (recall the oversampling factor was M=100) of the signal at the receiver (after the demodulation, LPF, and pulse correlator filter). The first three symbol values are -3, +3, -3, which can be deciphered from the signal assuming the delay can be selected appropriately.
The first four symbol periods (recall the oversampling factor was M = 100 ) of the signal at the receiver (after the demodulation, LPF, and pulse correlator filter). Thefirst three symbol values are - 3 , + 3 , - 3 , which can be deciphered from the signal assuming the delay can be selected appropriately.

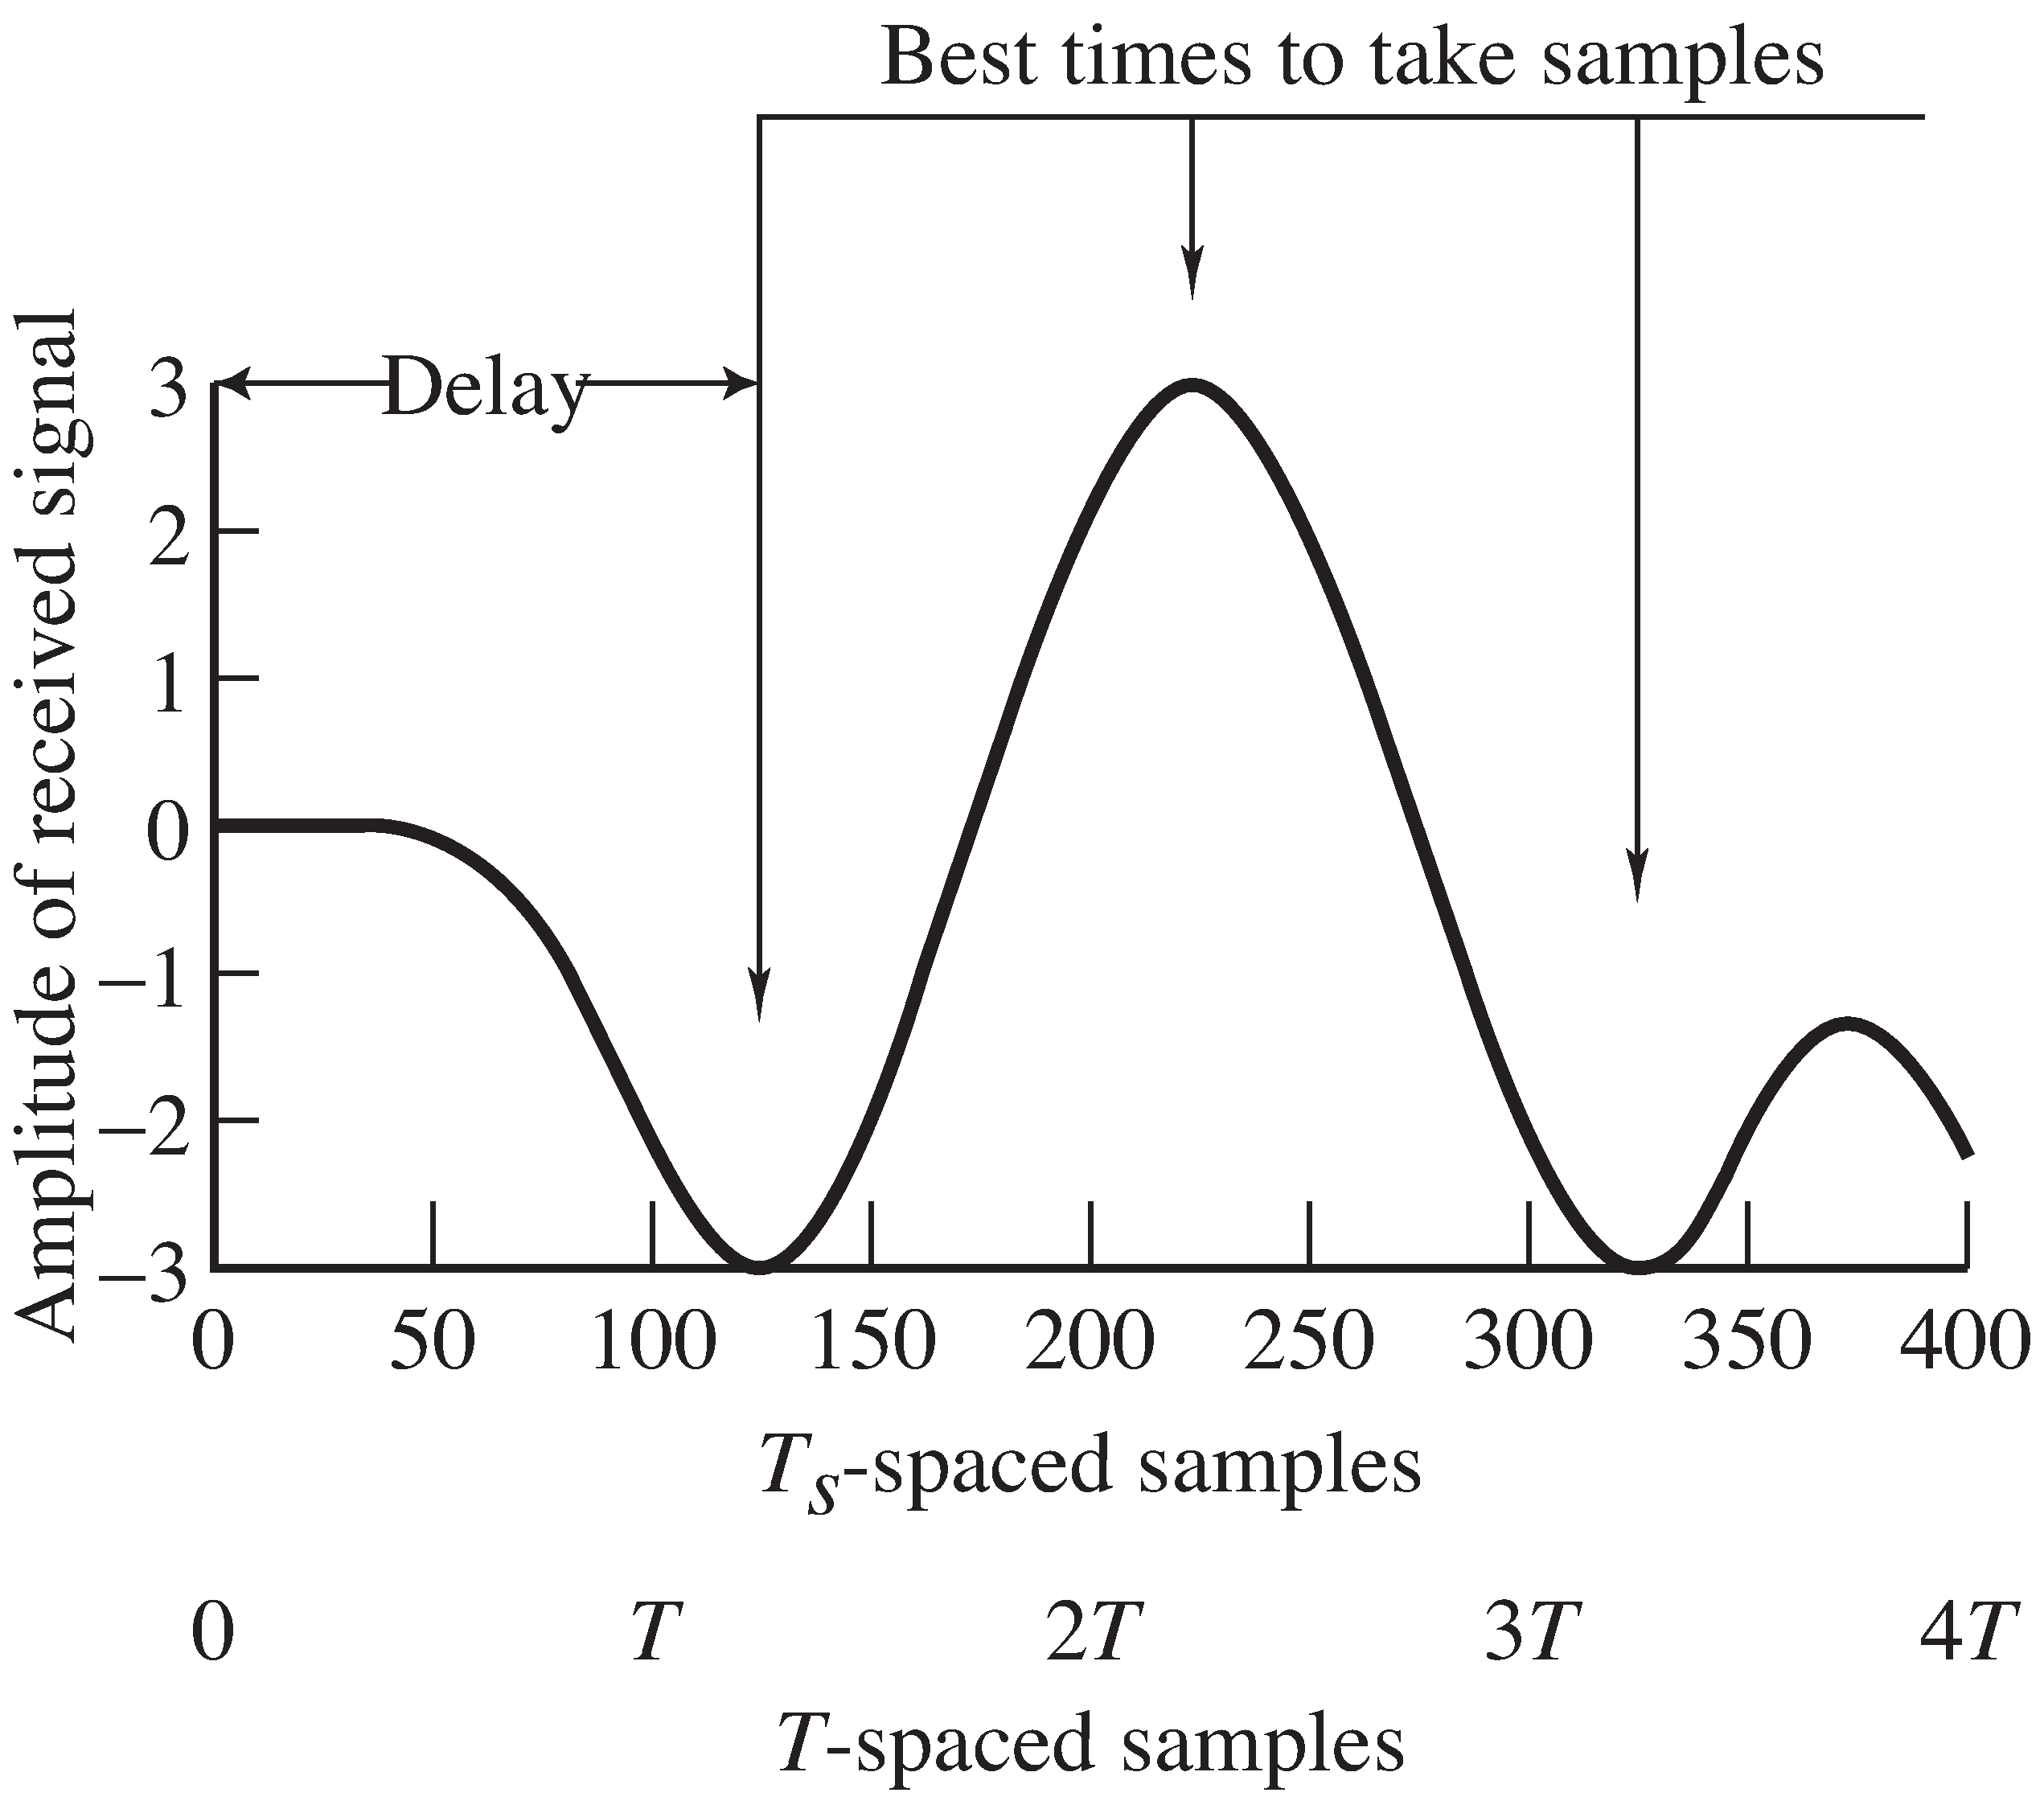
Selecting this delay and the associated downsampling are accomplished in the code % downsample to symbol rate z=y(0.5*fl+M:M:end); in idsys.m , which recovers the T -spaced samples z . With reference to [link] , the parameter l in the downsampling block is 125.

A revealing extension of [link] is to plot the oversampled waveform y for the complete transmission in order to see if the subsequent peaks of the pulsesoccur at regular intervals precisely on source alphabet symbol values, as we would hope.However, even for small messages (such as the wiener jingle), squeezing such a figure onto one graph makes a detailedvisual examination of the peaks fruitless. This is precisely why we plotted [link] —to see the detailed timing information for the first few symbols.

One idea is to plot the next four symbol periods on top of the first four by shifting the start of the second blockto time zero. Continuing this approach throughout the data recordmimics the behavior of a well-adjusted oscilloscope that triggers at the same point in each symbol group.This operation can be implemented in M atlab by first determining the maximum number of groups of 4*M samples that fit inside the vector y from the l th sample on. Let ul=floor((length(y)-l-1)/(4*M)); then the reshape command can be used to form a matrix with 4*M rows and ul columns. This is easily plotted using plot(reshape(y(l:ul*4*M+124),4*M,ul)) and the result is shown in [link] . Note that the first element plotted in [link] is the lth element of [link] . This type of figure, called an eye diagram , is commonly used in practice as an aid introubleshooting. Eye diagrams will also be used routinely in succeeding chapters.

Questions & Answers

Discuss the differences between taste and flavor, including how other sensory inputs contribute to our  perception of flavor.
John Reply
taste refers to your understanding of the flavor . while flavor one The other hand is refers to sort of just a blend things.
Faith
While taste primarily relies on our taste buds, flavor involves a complex interplay between taste and aroma
Kamara
which drugs can we use for ulcers
Ummi Reply
omeprazole
Kamara
what
Renee
what is this
Renee
is a drug
Kamara
of anti-ulcer
Kamara
Omeprazole Cimetidine / Tagament For the complicated once ulcer - kit
Patrick
what is the function of lymphatic system
Nency Reply
Not really sure
Eli
to drain extracellular fluid all over the body.
asegid
The lymphatic system plays several crucial roles in the human body, functioning as a key component of the immune system and contributing to the maintenance of fluid balance. Its main functions include: 1. Immune Response: The lymphatic system produces and transports lymphocytes, which are a type of
asegid
to transport fluids fats proteins and lymphocytes to the blood stream as lymph
Adama
what is anatomy
Oyindarmola Reply
Anatomy is the identification and description of the structures of living things
Kamara
what's the difference between anatomy and physiology
Oyerinde Reply
Anatomy is the study of the structure of the body, while physiology is the study of the function of the body. Anatomy looks at the body's organs and systems, while physiology looks at how those organs and systems work together to keep the body functioning.
AI-Robot
what is enzymes all about?
Mohammed Reply
Enzymes are proteins that help speed up chemical reactions in our bodies. Enzymes are essential for digestion, liver function and much more. Too much or too little of a certain enzyme can cause health problems
Kamara
yes
Prince
how does the stomach protect itself from the damaging effects of HCl
Wulku Reply
little girl okay how does the stomach protect itself from the damaging effect of HCL
Wulku
it is because of the enzyme that the stomach produce that help the stomach from the damaging effect of HCL
Kamara
function of digestive system
Ali Reply
function of digestive
Ali
the diagram of the lungs
Adaeze Reply
what is the normal body temperature
Diya Reply
37 degrees selcius
Xolo
37°c
Stephanie
please why 37 degree selcius normal temperature
Mark
36.5
Simon
37°c
Iyogho
the normal temperature is 37°c or 98.6 °Fahrenheit is important for maintaining the homeostasis in the body the body regular this temperature through the process called thermoregulation which involves brain skin muscle and other organ working together to maintain stable internal temperature
Stephanie
37A c
Wulku
what is anaemia
Diya Reply
anaemia is the decrease in RBC count hemoglobin count and PVC count
Eniola
what is the pH of the vagina
Diya Reply
how does Lysin attack pathogens
Diya
acid
Mary
I information on anatomy position and digestive system and there enzyme
Elisha Reply
anatomy of the female external genitalia
Muhammad Reply
Organ Systems Of The Human Body (Continued) Organ Systems Of The Human Body (Continued)
Theophilus Reply
what's lochia albra
Kizito
Got questions? Join the online conversation and get instant answers!
Jobilize.com Reply

Get Jobilize Job Search Mobile App in your pocket Now!

Get it on Google Play Download on the App Store Now


Source:  OpenStax, Software receiver design. OpenStax CNX. Aug 13, 2013 Download for free at http://cnx.org/content/col11510/1.3
Google Play and the Google Play logo are trademarks of Google Inc.

Notification Switch

Would you like to follow the 'Software receiver design' conversation and receive update notifications?

Ask