<< Chapter < Page Chapter >> Page >
  • Explain work as a transfer of energy and net work as the work done by the net force.
  • Explain and apply the work-energy theorem.

Work transfers energy

What happens to the work done on a system? Energy is transferred into the system, but in what form? Does it remain in the system or move on? The answers depend on the situation. For example, if the lawn mower in [link] (a) is pushed just hard enough to keep it going at a constant speed, then energy put into the mower by the person is removed continuously by friction, and eventually leaves the system in the form of heat transfer. In contrast, work done on the briefcase by the person carrying it up stairs in [link] (d) is stored in the briefcase-Earth system and can be recovered at any time, as shown in [link] (e). In fact, the building of the pyramids in ancient Egypt is an example of storing energy in a system by doing work on the system. Some of the energy imparted to the stone blocks in lifting them during construction of the pyramids remains in the stone-Earth system and has the potential to do work.

In this section we begin the study of various types of work and forms of energy. We will find that some types of work leave the energy of a system constant, for example, whereas others change the system in some way, such as making it move. We will also develop definitions of important forms of energy, such as the energy of motion.

Net work and the work-energy theorem

We know from the study of Newton’s laws in Dynamics: Force and Newton's Laws of Motion that net force causes acceleration. We will see in this section that work done by the net force gives a system energy of motion, and in the process we will also find an expression for the energy of motion.

Let us start by considering the total, or net, work done on a system. Net work is defined to be the sum of work done by all external forces—that is, net work    is the work done by the net external force F net size 12{F rSub { size 8{"net"} } } {} . In equation form, this is W net = F net d cos θ size 12{W rSub { size 8{"net"} } =F rSub { size 8{"net"} } d"cos"θ} {} where θ size 12{θ} {} is the angle between the force vector and the displacement vector.

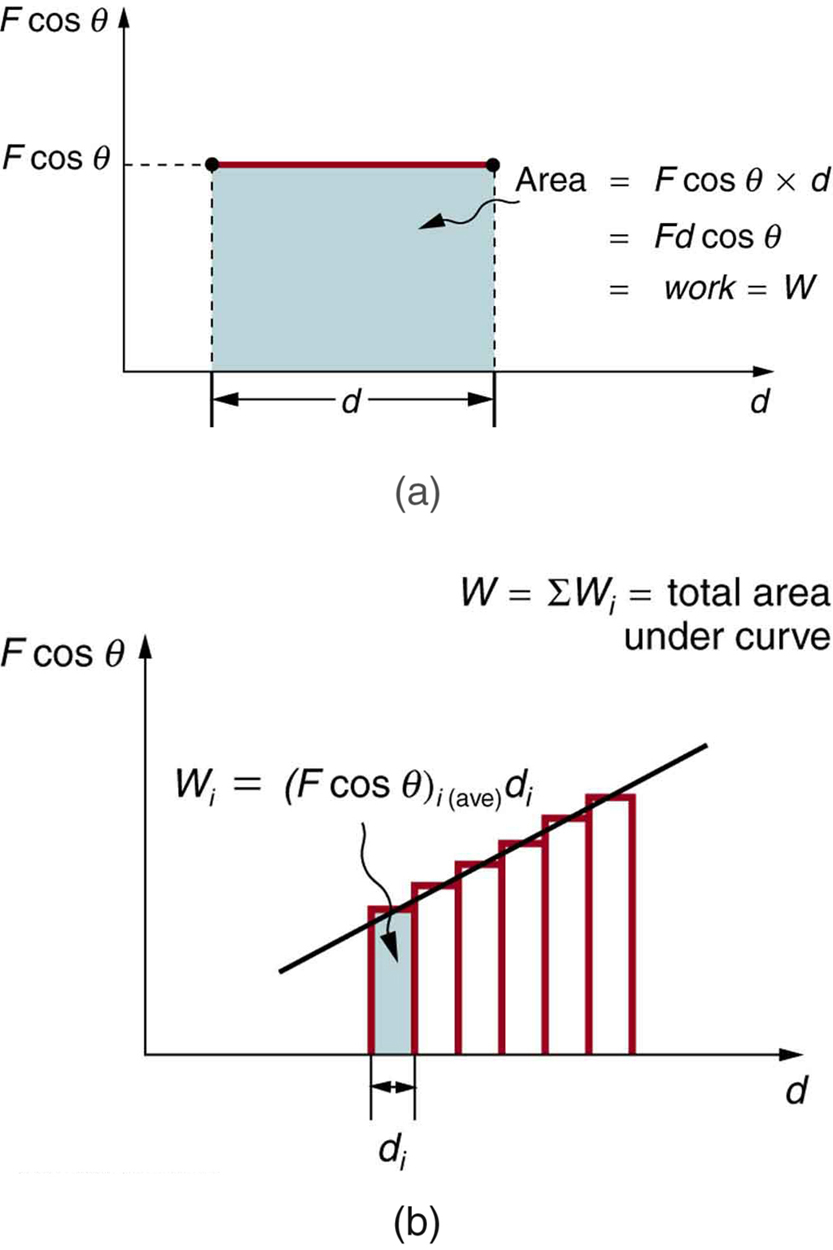
[link] (a) shows a graph of force versus displacement for the component of the force in the direction of the displacement—that is, an F cos θ size 12{F"cos"θ} {} vs. d size 12{d} {} graph. In this case, F cos θ size 12{F"cos"θ} {} is constant. You can see that the area under the graph is F d cos θ size 12{F"cos"θ} {} , or the work done. [link] (b) shows a more general process where the force varies. The area under the curve is divided into strips, each having an average force ( F cos θ ) i ( ave ) size 12{ \( F"cos"θ \) rSub { size 8{i \( "ave" \) } } } {} . The work done is ( F cos θ ) i ( ave ) d i size 12{ \( F"cos"θ \) rSub { size 8{i \( "ave" \) } } d rSub { size 8{i} } } {} for each strip, and the total work done is the sum of the W i size 12{W rSub { size 8{i} } } {} . Thus the total work done is the total area under the curve, a useful property to which we shall refer later.

Two drawings labele a and b. (a) A graph of force component F cosine theta versus distance d. d is along the x axis and F cosine theta is along the y axis. A line of length d is drawn parallel to the horizontal axis for some value of F cosine theta. Area under this line in the graph is shaded and is equal to F cosine theta multiplied by d. F d cosine theta is equal to work W. (b) A graph of force component F cosine theta versus distance d. d is along the x axis and F cosine theta is along the y axis. There is an inclined line and the area under it is divided into many thin vertical strips of width d sub i. The area of one vertical stripe is equal to average value of F cosine theta times d sub i which equals to work W sub i.
(a) A graph of F cos θ vs. d size 12{d} {} , when F cos θ size 12{F"cos"θ} {} is constant. The area under the curve represents the work done by the force. (b) A graph of F cos θ size 12{F"cos"q} {} vs. d size 12{d} {} in which the force varies. The work done for each interval is the area of each strip; thus, the total area under the curve equals the total work done.

Net work will be simpler to examine if we consider a one-dimensional situation where a force is used to accelerate an object in a direction parallel to its initial velocity. Such a situation occurs for the package on the roller belt conveyor system shown in [link] .

Questions & Answers

differentiate between demand and supply giving examples
Lambiv Reply
differentiated between demand and supply using examples
Lambiv
what is labour ?
Lambiv
how will I do?
Venny Reply
how is the graph works?I don't fully understand
Rezat Reply
information
Eliyee
devaluation
Eliyee
t
WARKISA
hi guys good evening to all
Lambiv
multiple choice question
Aster Reply
appreciation
Eliyee
explain perfect market
Lindiwe Reply
In economics, a perfect market refers to a theoretical construct where all participants have perfect information, goods are homogenous, there are no barriers to entry or exit, and prices are determined solely by supply and demand. It's an idealized model used for analysis,
Ezea
What is ceteris paribus?
Shukri Reply
other things being equal
AI-Robot
When MP₁ becomes negative, TP start to decline. Extuples Suppose that the short-run production function of certain cut-flower firm is given by: Q=4KL-0.6K2 - 0.112 • Where is quantity of cut flower produced, I is labour input and K is fixed capital input (K-5). Determine the average product of lab
Kelo
Extuples Suppose that the short-run production function of certain cut-flower firm is given by: Q=4KL-0.6K2 - 0.112 • Where is quantity of cut flower produced, I is labour input and K is fixed capital input (K-5). Determine the average product of labour (APL) and marginal product of labour (MPL)
Kelo
yes,thank you
Shukri
Can I ask you other question?
Shukri
what is monopoly mean?
Habtamu Reply
What is different between quantity demand and demand?
Shukri Reply
Quantity demanded refers to the specific amount of a good or service that consumers are willing and able to purchase at a give price and within a specific time period. Demand, on the other hand, is a broader concept that encompasses the entire relationship between price and quantity demanded
Ezea
ok
Shukri
how do you save a country economic situation when it's falling apart
Lilia Reply
what is the difference between economic growth and development
Fiker Reply
Economic growth as an increase in the production and consumption of goods and services within an economy.but Economic development as a broader concept that encompasses not only economic growth but also social & human well being.
Shukri
production function means
Jabir
What do you think is more important to focus on when considering inequality ?
Abdisa Reply
any question about economics?
Awais Reply
sir...I just want to ask one question... Define the term contract curve? if you are free please help me to find this answer 🙏
Asui
it is a curve that we get after connecting the pareto optimal combinations of two consumers after their mutually beneficial trade offs
Awais
thank you so much 👍 sir
Asui
In economics, the contract curve refers to the set of points in an Edgeworth box diagram where both parties involved in a trade cannot be made better off without making one of them worse off. It represents the Pareto efficient allocations of goods between two individuals or entities, where neither p
Cornelius
In economics, the contract curve refers to the set of points in an Edgeworth box diagram where both parties involved in a trade cannot be made better off without making one of them worse off. It represents the Pareto efficient allocations of goods between two individuals or entities,
Cornelius
Suppose a consumer consuming two commodities X and Y has The following utility function u=X0.4 Y0.6. If the price of the X and Y are 2 and 3 respectively and income Constraint is birr 50. A,Calculate quantities of x and y which maximize utility. B,Calculate value of Lagrange multiplier. C,Calculate quantities of X and Y consumed with a given price. D,alculate optimum level of output .
Feyisa Reply
Answer
Feyisa
c
Jabir
the market for lemon has 10 potential consumers, each having an individual demand curve p=101-10Qi, where p is price in dollar's per cup and Qi is the number of cups demanded per week by the i th consumer.Find the market demand curve using algebra. Draw an individual demand curve and the market dema
Gsbwnw Reply
suppose the production function is given by ( L, K)=L¼K¾.assuming capital is fixed find APL and MPL. consider the following short run production function:Q=6L²-0.4L³ a) find the value of L that maximizes output b)find the value of L that maximizes marginal product
Abdureman
types of unemployment
Yomi Reply
What is the difference between perfect competition and monopolistic competition?
Mohammed
Got questions? Join the online conversation and get instant answers!
Jobilize.com Reply
Practice Key Terms 3

Get Jobilize Job Search Mobile App in your pocket Now!

Get it on Google Play Download on the App Store Now


Source:  OpenStax, Unit 5 - work and energy. OpenStax CNX. Jan 02, 2016 Download for free at https://legacy.cnx.org/content/col11946/1.1
Google Play and the Google Play logo are trademarks of Google Inc.

Notification Switch

Would you like to follow the 'Unit 5 - work and energy' conversation and receive update notifications?

Ask