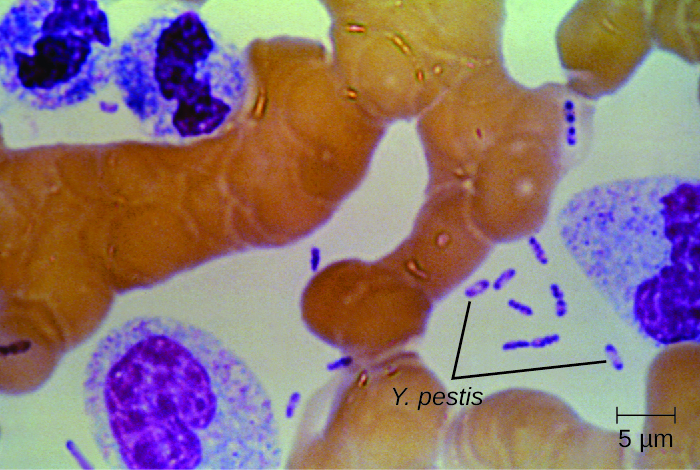
This Wright’s stain of a blood sample from a patient with plague shows the characteristic “safety pin” appearance of
Yersinia pestis . (credit: modification of work by Centers for Disease Control and Prevention)
Compare bubonic plague, septicemic plague, and pneumonic plague.
The history of the plague
The first recorded pandemic of plague, the
Justinian plague , occurred in the sixth century CE. It is thought to have originated in central Africa and spread to the Mediterranean through trade routes. At its peak, more than 5,000 people died per day in Constantinople alone. Ultimately, one-third of that city’s population succumbed to plague.
Rosen, William. Justinian’s Flea: Plague, Empire, and the Birth of Europe. Viking Adult; pg 3; ISBN 978-0-670-03855-8. The impact of this outbreak probably contributed to the later fall of Emperor Justinian.
The second major pandemic, dubbed the
Black Death , occurred during the 14th century. This time, the infections are thought to have originated somewhere in Asia before being transported to Europe by trade, soldiers, and war refugees. This outbreak killed an estimated one-quarter of the population of Europe (25 million, primarily in major cities). In addition, at least another 25 million are thought to have been killed in Asia and Africa.
Benedictow, Ole J. 2004. The Black Death 1346-1353: The Complete History. Woodbridge: Boydell Press. This second pandemic, associated with strain
Yersinia pestis biovar Medievalis, cycled for another 300 years in Europe and Great Britain, and was called the Great Plague in the 1660s.
The most recent pandemic occurred in the 1890s with
Yersinia pestis biovar Orientalis. This outbreak originated in the Yunnan province of China and spread worldwide through trade. It is at this time that plague made its way to the US. The etiologic agent of plague was discovered by Alexandre Yersin (1863–1943) during this outbreak as well. The overall number of deaths was lower than in prior outbreaks, perhaps because of improved sanitation and medical support.
Centers for Disease Control and Prevention. “Plague: History.” http://www.cdc.gov/plague/history/. Accessed September 15, 2016. Most of the deaths attributed to this final pandemic occurred in India.
Visit this
link to see a video describing how similar the genome of the Black Death bacterium is to today’s strains of bubonic plague.
Zoonotic febrile diseases
A wide variety of zoonotic febrile diseases (diseases that cause fever) are caused by pathogenic bacteria that require arthropod vectors. These pathogens are either obligate intracellular species of
Anaplasma, Bartonella ,
Ehrlichia, Orientia, and
Rickettsia , or spirochetes in the genus
Borrelia . Isolation and identification of pathogens in this group are best performed in
BSL-3 laboratories because of the low infective dose associated with the diseases.
Anaplasmosis
The zoonotic tickborne disease
human granulocytic anaplasmosis (HGA) is caused by the obligate intracellular pathogen
Anaplasma phagocytophilum . HGA is endemic primarily in the central and northeastern US and in countries in Europe and Asia.
Questions & Answers
differentiate between demand and supply
giving examples
In economics, a perfect market refers to a theoretical construct where all participants have perfect information, goods are homogenous, there are no barriers to entry or exit, and prices are determined solely by supply and demand. It's an idealized model used for analysis,
When MP₁ becomes negative, TP start to decline.
Extuples Suppose that the short-run production function of certain cut-flower firm is given by: Q=4KL-0.6K2 - 0.112 •
Where is quantity of cut flower produced, I is labour input and K is fixed capital input (K-5). Determine the average product of lab
Kelo
Extuples Suppose that the short-run production function of certain cut-flower firm is given by: Q=4KL-0.6K2 - 0.112 •
Where is quantity of cut flower produced, I is labour input and K is fixed capital input (K-5). Determine the average product of labour (APL) and marginal product of labour (MPL)
Quantity demanded refers to the specific amount of a good or service that consumers are willing and able to purchase at a give price and within a specific time period. Demand, on the other hand, is a broader concept that encompasses the entire relationship between price and quantity demanded
Ezea
ok
Shukri
how do you save a country economic situation when it's falling apart
Economic growth as an increase in the production and consumption of goods and services within an economy.but
Economic development as a broader concept that encompasses not only economic growth but also social & human well being.
Shukri
production function means
Jabir
What do you think is more important to focus on when considering inequality ?
sir...I just want to ask one question... Define the term contract curve? if you are free please help me to find this answer 🙏
Asui
it is a curve that we get after connecting the pareto optimal combinations of two consumers after their mutually beneficial trade offs
Awais
thank you so much 👍 sir
Asui
In economics, the contract curve refers to the set of points in an Edgeworth box diagram where both parties involved in a trade cannot be made better off without making one of them worse off. It represents the Pareto efficient allocations of goods between two individuals or entities, where neither p
Cornelius
In economics, the contract curve refers to the set of points in an Edgeworth box diagram where both parties involved in a trade cannot be made better off without making one of them worse off. It represents the Pareto efficient allocations of goods between two individuals or entities,
Cornelius
Suppose a consumer consuming two commodities X and Y has
The following utility function u=X0.4 Y0.6. If the price of the X and Y are 2 and 3 respectively and income Constraint is birr 50.
A,Calculate quantities of x and y which maximize utility.
B,Calculate value of Lagrange multiplier.
C,Calculate quantities of X and Y consumed with a given price.
D,alculate optimum level of output .
the market for lemon has 10 potential consumers, each having an individual demand curve p=101-10Qi, where p is price in dollar's per cup and Qi is the number of cups demanded per week by the i th consumer.Find the market demand curve using algebra. Draw an individual demand curve and the market dema
suppose the production function is given by ( L, K)=L¼K¾.assuming capital is fixed find APL and MPL. consider the following short run production function:Q=6L²-0.4L³ a) find the value of L that maximizes output b)find the value of L that maximizes marginal product