<< Chapter < Page Chapter >> Page >
  • With a doubling time of 30 minutes and a starting population size of 1 × 10 5 cells, how many cells will be present after 2 hours, assuming no cell death?

The growth curve

Microorganisms grown in closed culture (also known as a batch culture ), in which no nutrients are added and most waste is not removed, follow a reproducible growth pattern referred to as the growth curve . An example of a batch culture in nature is a pond in which a small number of cells grow in a closed environment. The culture density is defined as the number of cells per unit volume. In a closed environment, the culture density is also a measure of the number of cells in the population. Infections of the body do not always follow the growth curve, but correlations can exist depending upon the site and type of infection. When the number of live cells is plotted against time, distinct phases can be observed in the curve ( [link] ).

A graph with time on the X axis and logarithm of living bacterial cells on the Y axis. The line of the graph begins towards the bottom of the Y axis and is flat for a short time. This is labeled 1) lag phase: no increase in number of living bacterial cells. Next the line slopes upwards. This is labeled Log phase: exponential increase in number of living bacterial cells. Next the line flattens again. This is labeled 3) Stationary phase: plateau in number of living bacterial cells; rate of cell division and death roughly equal. Final the line slopes downwards. This is labeled 4) Death or decline phase: exponential decrease in number of living bacterial cells.
The growth curve of a bacterial culture is represented by the logarithm of the number of live cells plotted as a function of time. The graph can be divided into four phases according to the slope, each of which matches events in the cell. The four phases are lag, log, stationary, and death.

The lag phase

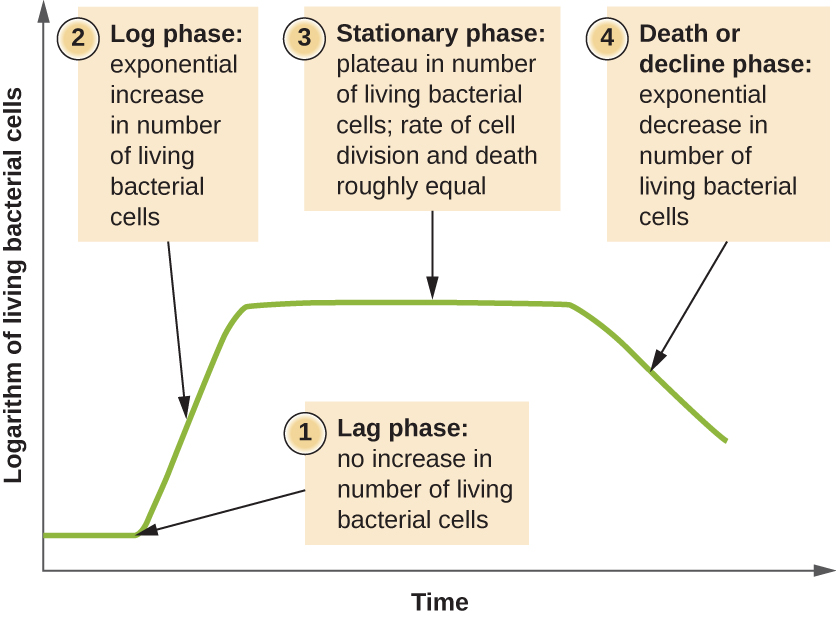
The beginning of the growth curve represents a small number of cells, referred to as an inoculum , that are added to a fresh culture medium , a nutritional broth that supports growth. The initial phase of the growth curve is called the lag phase , during which cells are gearing up for the next phase of growth. The number of cells does not change during the lag phase; however, cells grow larger and are metabolically active, synthesizing proteins needed to grow within the medium. If any cells were damaged or shocked during the transfer to the new medium, repair takes place during the lag phase. The duration of the lag phase is determined by many factors, including the species and genetic make-up of the cells, the composition of the medium, and the size of the original inoculum.

The log phase

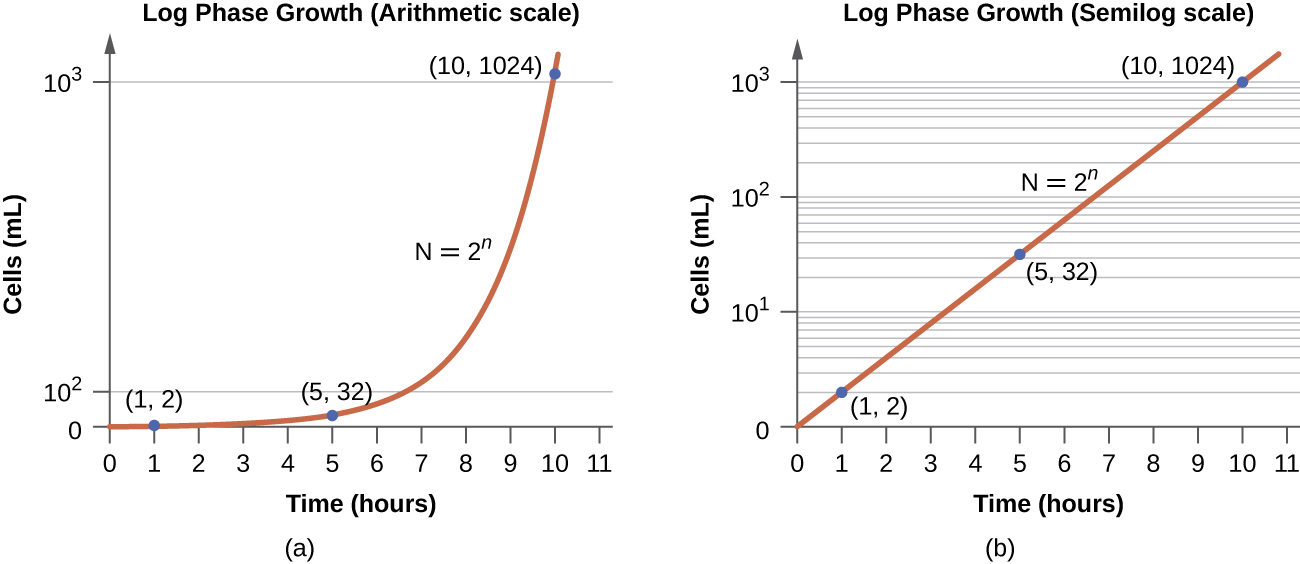
In the logarithmic (log) growth phase , sometimes called exponential growth phase , the cells are actively dividing by binary fission and their number increases exponentially. For any given bacterial species, the generation time under specific growth conditions (nutrients, temperature, pH, and so forth) is genetically determined, and this generation time is called the intrinsic growth rate . During the log phase, the relationship between time and number of cells is not linear but exponential; however, the growth curve is often plotted on a semilogarithmic graph, as shown in [link] , which gives the appearance of a linear relationship.

a) An arithmetic scale graph showing log phase growth. The X axis is time (hours) and the Y ais is cells per ml. The line on this graph starts fairly flat with readings of (1,2) and (5,32) but quickly slopes up steeply with a final reading of (10, 1024). B) is a semilog scale graph of log phase growth. Again the X axis is time (hours) and the Y axis is cells per ml. But the intervals of the Y axis more clearly show the difference between 10 superscript 1 and 10 superscript 3. The line on this graph is a straight line diagonally across the graph with points of (1,2), (5,32) and (10,1024) – just like the first graph. The equation for both graphs is N=2 superscript n.
Both graphs illustrate population growth during the log phase for a bacterial sample with an initial population of one cell and a doubling time of 1 hour. (a) When plotted on an arithmetic scale, the growth rate resembles a curve. (b) When plotted on a semilogarithmic scale (meaning the values on the y -axis are logarithmic), the growth rate appears linear.

Cells in the log phase show constant growth rate and uniform metabolic activity. For this reason, cells in the log phase are preferentially used for industrial applications and research work. The log phase is also the stage where bacteria are the most susceptible to the action of disinfectants and common antibiotics that affect protein, DNA, and cell-wall synthesis.

Questions & Answers

how does Neisseria cause meningitis
Nyibol Reply
what is microbiologist
Muhammad Reply
what is errata
Muhammad
is the branch of biology that deals with the study of microorganisms.
Ntefuni Reply
What is microbiology
Mercy Reply
studies of microbes
Louisiaste
when we takee the specimen which lumbar,spin,
Ziyad Reply
How bacteria create energy to survive?
Muhamad Reply
Bacteria doesn't produce energy they are dependent upon their substrate in case of lack of nutrients they are able to make spores which helps them to sustain in harsh environments
_Adnan
But not all bacteria make spores, l mean Eukaryotic cells have Mitochondria which acts as powerhouse for them, since bacteria don't have it, what is the substitution for it?
Muhamad
they make spores
Louisiaste
what is sporadic nd endemic, epidemic
Aminu Reply
the significance of food webs for disease transmission
Abreham
food webs brings about an infection as an individual depends on number of diseased foods or carriers dully.
Mark
explain assimilatory nitrate reduction
Esinniobiwa Reply
Assimilatory nitrate reduction is a process that occurs in some microorganisms, such as bacteria and archaea, in which nitrate (NO3-) is reduced to nitrite (NO2-), and then further reduced to ammonia (NH3).
Elkana
This process is called assimilatory nitrate reduction because the nitrogen that is produced is incorporated in the cells of microorganisms where it can be used in the synthesis of amino acids and other nitrogen products
Elkana
Examples of thermophilic organisms
Shu Reply
Give Examples of thermophilic organisms
Shu
advantages of normal Flora to the host
Micheal Reply
Prevent foreign microbes to the host
Abubakar
they provide healthier benefits to their hosts
ayesha
They are friends to host only when Host immune system is strong and become enemies when the host immune system is weakened . very bad relationship!
Mark
what is cell
faisal Reply
cell is the smallest unit of life
Fauziya
cell is the smallest unit of life
Akanni
ok
Innocent
cell is the structural and functional unit of life
Hasan
is the fundamental units of Life
Musa
what are emergency diseases
Micheal Reply
There are nothing like emergency disease but there are some common medical emergency which can occur simultaneously like Bleeding,heart attack,Breathing difficulties,severe pain heart stock.Hope you will get my point .Have a nice day ❣️
_Adnan
define infection ,prevention and control
Innocent
I think infection prevention and control is the avoidance of all things we do that gives out break of infections and promotion of health practices that promote life
Lubega
Heyy Lubega hussein where are u from?
_Adnan
en français
Adama
which site have a normal flora
ESTHER Reply
Many sites of the body have it Skin Nasal cavity Oral cavity Gastro intestinal tract
Safaa
skin
Asiina
skin,Oral,Nasal,GIt
Sadik
How can Commensal can Bacteria change into pathogen?
Sadik
How can Commensal Bacteria change into pathogen?
Sadik
all
Tesfaye
by fussion
Asiina
what are the advantages of normal Flora to the host
Micheal
what are the ways of control and prevention of nosocomial infection in the hospital
Micheal
what is inflammation
Shelly Reply
part of a tissue or an organ being wounded or bruised.
Wilfred
what term is used to name and classify microorganisms?
Micheal Reply
Binomial nomenclature
adeolu

Get Jobilize Job Search Mobile App in your pocket Now!

Get it on Google Play Download on the App Store Now


Source:  OpenStax, Microbiology. OpenStax CNX. Nov 01, 2016 Download for free at http://cnx.org/content/col12087/1.4
Google Play and the Google Play logo are trademarks of Google Inc.

Notification Switch

Would you like to follow the 'Microbiology' conversation and receive update notifications?

Ask