<< Chapter < Page
  Digital signal processing - dsp     Page 9 / 19
Chapter >> Page >

What we have learned so far

So far, the main things that we have learned is that shorter pulses require greater bandwidth, and the bandwidth required to faithfully represent atruncated sinusoidal pulse is the reciprocal of the length of the pulse.

Separating closely spaced frequencies

Now we will look at the issues involved in using spectral analysis to separate and identify the frequencies of two closely-spaced spectral peaks for apulse composed of the sum of two sinusoids. Once again, we will begin by looking at some results and then discuss the code that produced those results.

Five new pulses

The five pulses that we will be working with in this example are shown in Figure 4 . As you can see, these pulses are a little more ugly than the pulses shown in Figure 1 . As you can also see, as was the case in Figure 1 , each pulse appears to be a shorter or longer version of the other pulses in terms of itswaveform.

Figure 4. Five pulses with two sinusoids each.
missing image

Produced by dsp032a

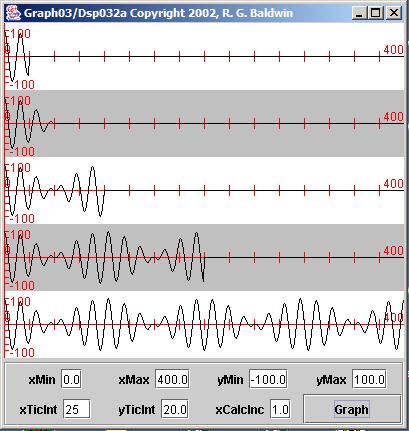
The plots in Figure 4 were produced by the program named Dsp032a , which I will briefly discuss later. (A complete listing of the program is shown in Listing 11 near the end of the module.) This program creates and displays pulses identical to those processed by the program named Dsp032 , which I will also briefly discuss later. (A complete listing of the program named Dsp32 is presented in Listing 12 .)

Five time series containing pulses

The program creates and displays five separate time series, each 400 samples in length. Each time series contains a pulse and the pulses are differentlengths. As before, each of the pulses shown in Figure 4 is half the length of the pulse below it.

The sum of two sinusoids

Each pulse consists of the sum of two sinusoids at closely spaced frequencies. The frequencies of the two sinusoids for all pulses are the same.

All frequency values are specified as type double as a fraction of the sampling frequency. The frequencies of the two sinusoids areequidistant from a center frequency of 0.0625 times the sampling frequency.

(Recall that 0.0625 was the frequency of the only sinusoid contained in the pulses shown in Figure 1 and processed by the program named Dsp031 .)

The frequencies and pulse lengths

The frequency of one sinusoid is (0.0625 - 2.0/len) times the sampling frequency, where len is the length of the time series containing the pulse. (The value for len is 400 samples in this program.) The frequency of the other sinusoid is (0.0625 + 2.0/len) times the sampling frequency.

The lengths of the five pulses are:

  • 25 samples
  • 50 samples
  • 100 samples
  • 200 samples
  • 400 samples

(Note that Figure 4 has tick marks every 25 samples.)

The program named Dsp032a

The only new code in this program is the code in the constructor that creates the pulses and stores them in the data arrays. This code consists of fiveseparate for loops, one for each pulse. The code for the first for loop, which is typical of the five, is shown in Listing 6 .

Listing 6. New code in the the program named Dsp032a.
public Dsp032a(){//constructor //Create the raw datafor(int x = 0;x<len/16;x++){ data1[x]= amp*Math.cos(2*pi*x*freq1) + amp*Math.cos(2*pi*x*freq2);}//end for loop //... code removed for brevity}//end constructor

Questions & Answers

differentiate between demand and supply giving examples
Lambiv Reply
differentiated between demand and supply using examples
Lambiv
what is labour ?
Lambiv
how will I do?
Venny Reply
how is the graph works?I don't fully understand
Rezat Reply
information
Eliyee
devaluation
Eliyee
t
WARKISA
hi guys good evening to all
Lambiv
multiple choice question
Aster Reply
appreciation
Eliyee
explain perfect market
Lindiwe Reply
In economics, a perfect market refers to a theoretical construct where all participants have perfect information, goods are homogenous, there are no barriers to entry or exit, and prices are determined solely by supply and demand. It's an idealized model used for analysis,
Ezea
What is ceteris paribus?
Shukri Reply
other things being equal
AI-Robot
When MP₁ becomes negative, TP start to decline. Extuples Suppose that the short-run production function of certain cut-flower firm is given by: Q=4KL-0.6K2 - 0.112 • Where is quantity of cut flower produced, I is labour input and K is fixed capital input (K-5). Determine the average product of lab
Kelo
Extuples Suppose that the short-run production function of certain cut-flower firm is given by: Q=4KL-0.6K2 - 0.112 • Where is quantity of cut flower produced, I is labour input and K is fixed capital input (K-5). Determine the average product of labour (APL) and marginal product of labour (MPL)
Kelo
yes,thank you
Shukri
Can I ask you other question?
Shukri
what is monopoly mean?
Habtamu Reply
What is different between quantity demand and demand?
Shukri Reply
Quantity demanded refers to the specific amount of a good or service that consumers are willing and able to purchase at a give price and within a specific time period. Demand, on the other hand, is a broader concept that encompasses the entire relationship between price and quantity demanded
Ezea
ok
Shukri
how do you save a country economic situation when it's falling apart
Lilia Reply
what is the difference between economic growth and development
Fiker Reply
Economic growth as an increase in the production and consumption of goods and services within an economy.but Economic development as a broader concept that encompasses not only economic growth but also social & human well being.
Shukri
production function means
Jabir
What do you think is more important to focus on when considering inequality ?
Abdisa Reply
any question about economics?
Awais Reply
sir...I just want to ask one question... Define the term contract curve? if you are free please help me to find this answer 🙏
Asui
it is a curve that we get after connecting the pareto optimal combinations of two consumers after their mutually beneficial trade offs
Awais
thank you so much 👍 sir
Asui
In economics, the contract curve refers to the set of points in an Edgeworth box diagram where both parties involved in a trade cannot be made better off without making one of them worse off. It represents the Pareto efficient allocations of goods between two individuals or entities, where neither p
Cornelius
In economics, the contract curve refers to the set of points in an Edgeworth box diagram where both parties involved in a trade cannot be made better off without making one of them worse off. It represents the Pareto efficient allocations of goods between two individuals or entities,
Cornelius
Suppose a consumer consuming two commodities X and Y has The following utility function u=X0.4 Y0.6. If the price of the X and Y are 2 and 3 respectively and income Constraint is birr 50. A,Calculate quantities of x and y which maximize utility. B,Calculate value of Lagrange multiplier. C,Calculate quantities of X and Y consumed with a given price. D,alculate optimum level of output .
Feyisa Reply
Answer
Feyisa
c
Jabir
the market for lemon has 10 potential consumers, each having an individual demand curve p=101-10Qi, where p is price in dollar's per cup and Qi is the number of cups demanded per week by the i th consumer.Find the market demand curve using algebra. Draw an individual demand curve and the market dema
Gsbwnw Reply
suppose the production function is given by ( L, K)=L¼K¾.assuming capital is fixed find APL and MPL. consider the following short run production function:Q=6L²-0.4L³ a) find the value of L that maximizes output b)find the value of L that maximizes marginal product
Abdureman
types of unemployment
Yomi Reply
What is the difference between perfect competition and monopolistic competition?
Mohammed
Got questions? Join the online conversation and get instant answers!
Jobilize.com Reply

Get Jobilize Job Search Mobile App in your pocket Now!

Get it on Google Play Download on the App Store Now


Source:  OpenStax, Digital signal processing - dsp. OpenStax CNX. Jan 06, 2016 Download for free at https://legacy.cnx.org/content/col11642/1.38
Google Play and the Google Play logo are trademarks of Google Inc.

Notification Switch

Would you like to follow the 'Digital signal processing - dsp' conversation and receive update notifications?

Ask