<< Chapter < Page
  Digital signal processing - dsp     Page 6 / 14
Chapter >> Page >

The real part is the same

The real part of the transform of the input series in Figure 3 has the same shape as the real parts of the transforms of the input series in Figure 1 and Figure 2 . This is what would be produced by adding the real parts of the transforms of the pulses in Figure 1 and Figure 2 , and then normalizing the result.

The imaginary part sums to zero

The imaginary part of the transform of the input series in Figure 3 is zero at all sample values. This is what would be produced by adding theimaginary parts of the transforms of the input series in Figure 1 and Figure 2 .

(Recall that the values in the imaginary parts of the two earlier transforms had the same magnitude but opposite signs).

Thus, Figure 1 , Figure 2 , and Figure 3 demonstrate that the transform of the sum of two or more input series is equal to the sum of the transforms ofthe individual input series. The Fourier transform is a linear transform.

Single sample real pulse (impulse) with a delay

The real part of the transform of a single real sample with a shift relative to the origin has the shape of a cosine curve with a period that isproportional to the reciprocal of the shift. Negative sample values produce cosine curves with negative amplitudes.

A pulse of this type is often referred to an impulse.

The imaginary part of the transform of an impulse with a shift relative to the origin has the shape of a sine curve with a period that isproportional to the reciprocal of the shift. Negative sample values produce sine curves with negative amplitudes.

The magnitude of the transform is the square root of the sum of the squares of the real and imaginary parts at each output sample point. For thecase of a single input sample with a shift, that magnitude is constant for all output sample points and is proportional to the absolute value of thesample.

The above facts are illustrated in Figure 4 , Figure 5 , Figure 6 , and Figure 7 .

Figure 4. Transform of an impulse with no shift.
missing image

A shift of zero

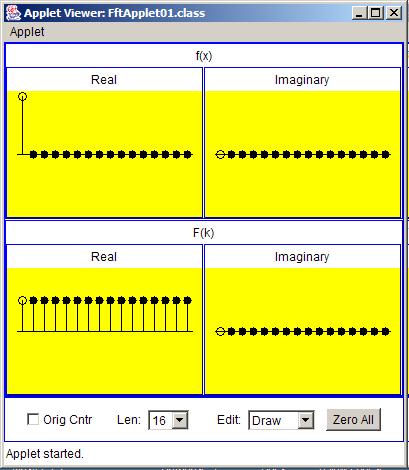
Figure 4 shows the transform of an impulse with a shift of zero relative to the origin.

(Note that in this series of figures, the origin was moved from the center to the left end. Once again, the sample with the empty circlerepresents the origin.)

Although it isn't obvious, the real part of the transform in Figure 4 has the shape of a cosine curve with a period that is the reciprocal of the shift.Because the shift is zero, the period of the cosine curve is infinite, producing real values that are constant at all output sample values.

Similarly, the imaginary part of the transform in Figure 4 has a shape that is a sine curve with an infinite period. Thus, it is zero at all output samplevalues.

A shift of one sample interval

Figure 5 shows the transform of an impulse with a negative value and a shift of one sample interval relative to the origin.

Figure 5. Transform of an impulse with a shift equal to one sample interval and a negative value.
missing image

A cosine curve and a sine curve

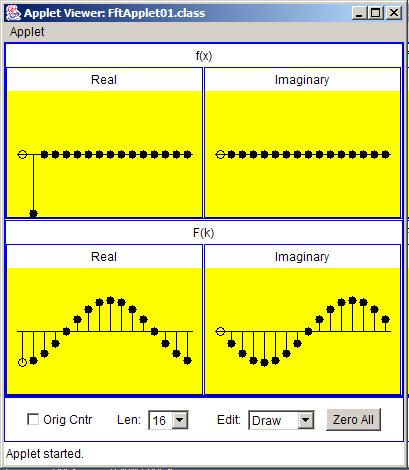
The shape of the real part of the transform output is an upside down cosine curve. It is upside down because it has a negative amplitude. This is caused by the fact that the input sample has a negative value.

Questions & Answers

differentiate between demand and supply giving examples
Lambiv Reply
differentiated between demand and supply using examples
Lambiv
what is labour ?
Lambiv
how will I do?
Venny Reply
how is the graph works?I don't fully understand
Rezat Reply
information
Eliyee
devaluation
Eliyee
t
WARKISA
hi guys good evening to all
Lambiv
multiple choice question
Aster Reply
appreciation
Eliyee
explain perfect market
Lindiwe Reply
In economics, a perfect market refers to a theoretical construct where all participants have perfect information, goods are homogenous, there are no barriers to entry or exit, and prices are determined solely by supply and demand. It's an idealized model used for analysis,
Ezea
What is ceteris paribus?
Shukri Reply
other things being equal
AI-Robot
When MP₁ becomes negative, TP start to decline. Extuples Suppose that the short-run production function of certain cut-flower firm is given by: Q=4KL-0.6K2 - 0.112 • Where is quantity of cut flower produced, I is labour input and K is fixed capital input (K-5). Determine the average product of lab
Kelo
Extuples Suppose that the short-run production function of certain cut-flower firm is given by: Q=4KL-0.6K2 - 0.112 • Where is quantity of cut flower produced, I is labour input and K is fixed capital input (K-5). Determine the average product of labour (APL) and marginal product of labour (MPL)
Kelo
yes,thank you
Shukri
Can I ask you other question?
Shukri
what is monopoly mean?
Habtamu Reply
What is different between quantity demand and demand?
Shukri Reply
Quantity demanded refers to the specific amount of a good or service that consumers are willing and able to purchase at a give price and within a specific time period. Demand, on the other hand, is a broader concept that encompasses the entire relationship between price and quantity demanded
Ezea
ok
Shukri
how do you save a country economic situation when it's falling apart
Lilia Reply
what is the difference between economic growth and development
Fiker Reply
Economic growth as an increase in the production and consumption of goods and services within an economy.but Economic development as a broader concept that encompasses not only economic growth but also social & human well being.
Shukri
production function means
Jabir
What do you think is more important to focus on when considering inequality ?
Abdisa Reply
any question about economics?
Awais Reply
sir...I just want to ask one question... Define the term contract curve? if you are free please help me to find this answer 🙏
Asui
it is a curve that we get after connecting the pareto optimal combinations of two consumers after their mutually beneficial trade offs
Awais
thank you so much 👍 sir
Asui
In economics, the contract curve refers to the set of points in an Edgeworth box diagram where both parties involved in a trade cannot be made better off without making one of them worse off. It represents the Pareto efficient allocations of goods between two individuals or entities, where neither p
Cornelius
In economics, the contract curve refers to the set of points in an Edgeworth box diagram where both parties involved in a trade cannot be made better off without making one of them worse off. It represents the Pareto efficient allocations of goods between two individuals or entities,
Cornelius
Suppose a consumer consuming two commodities X and Y has The following utility function u=X0.4 Y0.6. If the price of the X and Y are 2 and 3 respectively and income Constraint is birr 50. A,Calculate quantities of x and y which maximize utility. B,Calculate value of Lagrange multiplier. C,Calculate quantities of X and Y consumed with a given price. D,alculate optimum level of output .
Feyisa Reply
Answer
Feyisa
c
Jabir
the market for lemon has 10 potential consumers, each having an individual demand curve p=101-10Qi, where p is price in dollar's per cup and Qi is the number of cups demanded per week by the i th consumer.Find the market demand curve using algebra. Draw an individual demand curve and the market dema
Gsbwnw Reply
suppose the production function is given by ( L, K)=L¼K¾.assuming capital is fixed find APL and MPL. consider the following short run production function:Q=6L²-0.4L³ a) find the value of L that maximizes output b)find the value of L that maximizes marginal product
Abdureman
types of unemployment
Yomi Reply
What is the difference between perfect competition and monopolistic competition?
Mohammed
Got questions? Join the online conversation and get instant answers!
Jobilize.com Reply

Get Jobilize Job Search Mobile App in your pocket Now!

Get it on Google Play Download on the App Store Now


Source:  OpenStax, Digital signal processing - dsp. OpenStax CNX. Jan 06, 2016 Download for free at https://legacy.cnx.org/content/col11642/1.38
Google Play and the Google Play logo are trademarks of Google Inc.

Notification Switch

Would you like to follow the 'Digital signal processing - dsp' conversation and receive update notifications?

Ask