<< Chapter < Page
  Digital signal processing - dsp     Page 12 / 14
Chapter >> Page >

This method accepts an incoming complex sample value and the position in the series associated with that sample. The method corrects the real and imaginarytransform values for that complex sample to reflect the specified position in the input series.

After correcting the transform values for the sample on the basis of position, the method updates the corresponding real and imaginary valuescontained in array objects that are used to accumulate the real and imaginary values for all of the samples.

References to the array objects are received as input parameters. Outgoing results are scaled by an incoming parameter in an attempt to cause the outputvalues to fall within a reasonable range in case someone wants to plot them.

The incoming parameter named length specifies the number of output samples that are to be produced.

Hopefully this explanation will make it possible for you to understand the code in Listing 4 .

Note in particular the use of the Math.cos and Math.sin methods to apply the cosine and sine curves in the correction of the transforms of the individual complex samples. This is used to produceresults similar to those shown in Figure 5 through Figure 7 .

A real FFT program would probably compute the cosine and sine values only once, put them in a table and extract them from the table when needed.

Note the use of the position and length parameters in the computation of the angle that is passed as an argument to the Math.cos and Math.sin methods.

Also note how the correction is made separately on the real and imaginary parts of the input. This produces results similar to those shown in Figure 7 after those results are added in the accumulators.

Back to the main method

Returning now to the main method, the code in Listing 5 prepares the input data and the output arrays for the first case that we will look at. This case islabeled as Case A.

Listing 5. The remainder of the main method.
System.out.println("Case A"); double[]realInA = {0,1,0,0,0,0,0,0,0,0,0,0,0,0,0,1};double[] imagInA ={0,0,0,0,0,0,0,0,0,0,0,0,0,0,0,0}; double[]realOutA = new double[16];double[] imagOutA = new double[16]; //Perform the transform and display the// transformed results for the original // complex series.transform.doIt(realInA,imagInA,2.0,realOutA, imagOutA);display(realOutA,imagOutA);

Note that for Case A, the input complex series contains non-zero values only in the real part. Also, most of the values in the real part are zero.

The graphic form of Case A

Case A is shown in graphic form in Figure 9 . As you can see, the input series consists of two non-zero values in the real part. All the values in theimaginary part are zero.

Figure 9. Case A. Transform of a real sample with two non-zero values.
missing image

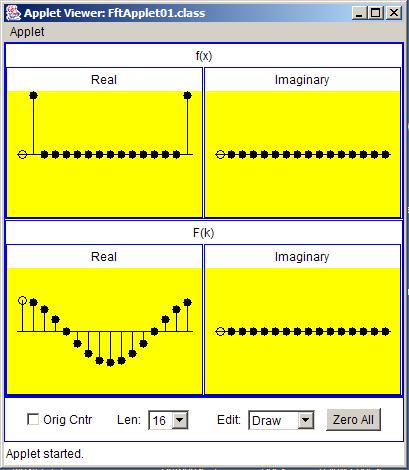
The real part of the transform of the complex input series looks like one cycle of a cosine curve. All of the values in the imaginary part of thetransform result are zero.

The numeric output for Case A

As you saw in Listing 5 , the code in the main method calls a method named display to display the complex transform output in numeric form on the screen. The output produced by Listing 5 is shown in Figure 10 . (Note that I manually inserted line breaks to force the material to fit in this narrowpublication format.)

Questions & Answers

differentiate between demand and supply giving examples
Lambiv Reply
differentiated between demand and supply using examples
Lambiv
what is labour ?
Lambiv
how will I do?
Venny Reply
how is the graph works?I don't fully understand
Rezat Reply
information
Eliyee
devaluation
Eliyee
t
WARKISA
hi guys good evening to all
Lambiv
multiple choice question
Aster Reply
appreciation
Eliyee
explain perfect market
Lindiwe Reply
In economics, a perfect market refers to a theoretical construct where all participants have perfect information, goods are homogenous, there are no barriers to entry or exit, and prices are determined solely by supply and demand. It's an idealized model used for analysis,
Ezea
What is ceteris paribus?
Shukri Reply
other things being equal
AI-Robot
When MP₁ becomes negative, TP start to decline. Extuples Suppose that the short-run production function of certain cut-flower firm is given by: Q=4KL-0.6K2 - 0.112 • Where is quantity of cut flower produced, I is labour input and K is fixed capital input (K-5). Determine the average product of lab
Kelo
Extuples Suppose that the short-run production function of certain cut-flower firm is given by: Q=4KL-0.6K2 - 0.112 • Where is quantity of cut flower produced, I is labour input and K is fixed capital input (K-5). Determine the average product of labour (APL) and marginal product of labour (MPL)
Kelo
yes,thank you
Shukri
Can I ask you other question?
Shukri
what is monopoly mean?
Habtamu Reply
What is different between quantity demand and demand?
Shukri Reply
Quantity demanded refers to the specific amount of a good or service that consumers are willing and able to purchase at a give price and within a specific time period. Demand, on the other hand, is a broader concept that encompasses the entire relationship between price and quantity demanded
Ezea
ok
Shukri
how do you save a country economic situation when it's falling apart
Lilia Reply
what is the difference between economic growth and development
Fiker Reply
Economic growth as an increase in the production and consumption of goods and services within an economy.but Economic development as a broader concept that encompasses not only economic growth but also social & human well being.
Shukri
production function means
Jabir
What do you think is more important to focus on when considering inequality ?
Abdisa Reply
any question about economics?
Awais Reply
sir...I just want to ask one question... Define the term contract curve? if you are free please help me to find this answer 🙏
Asui
it is a curve that we get after connecting the pareto optimal combinations of two consumers after their mutually beneficial trade offs
Awais
thank you so much 👍 sir
Asui
In economics, the contract curve refers to the set of points in an Edgeworth box diagram where both parties involved in a trade cannot be made better off without making one of them worse off. It represents the Pareto efficient allocations of goods between two individuals or entities, where neither p
Cornelius
In economics, the contract curve refers to the set of points in an Edgeworth box diagram where both parties involved in a trade cannot be made better off without making one of them worse off. It represents the Pareto efficient allocations of goods between two individuals or entities,
Cornelius
Suppose a consumer consuming two commodities X and Y has The following utility function u=X0.4 Y0.6. If the price of the X and Y are 2 and 3 respectively and income Constraint is birr 50. A,Calculate quantities of x and y which maximize utility. B,Calculate value of Lagrange multiplier. C,Calculate quantities of X and Y consumed with a given price. D,alculate optimum level of output .
Feyisa Reply
Answer
Feyisa
c
Jabir
the market for lemon has 10 potential consumers, each having an individual demand curve p=101-10Qi, where p is price in dollar's per cup and Qi is the number of cups demanded per week by the i th consumer.Find the market demand curve using algebra. Draw an individual demand curve and the market dema
Gsbwnw Reply
suppose the production function is given by ( L, K)=L¼K¾.assuming capital is fixed find APL and MPL. consider the following short run production function:Q=6L²-0.4L³ a) find the value of L that maximizes output b)find the value of L that maximizes marginal product
Abdureman
types of unemployment
Yomi Reply
What is the difference between perfect competition and monopolistic competition?
Mohammed
Got questions? Join the online conversation and get instant answers!
Jobilize.com Reply

Get Jobilize Job Search Mobile App in your pocket Now!

Get it on Google Play Download on the App Store Now


Source:  OpenStax, Digital signal processing - dsp. OpenStax CNX. Jan 06, 2016 Download for free at https://legacy.cnx.org/content/col11642/1.38
Google Play and the Google Play logo are trademarks of Google Inc.

Notification Switch

Would you like to follow the 'Digital signal processing - dsp' conversation and receive update notifications?

Ask