<< Chapter < Page Chapter >> Page >

Visit this website to read “The Federal Reserve Bank of Cleveland’s Economic Commentary: A New Approach to Gauging Inflation Expectations” by Joseph G. Haubrich for more information about how expected inflation is forecast.

The neoclassical phillips curve tradeoff

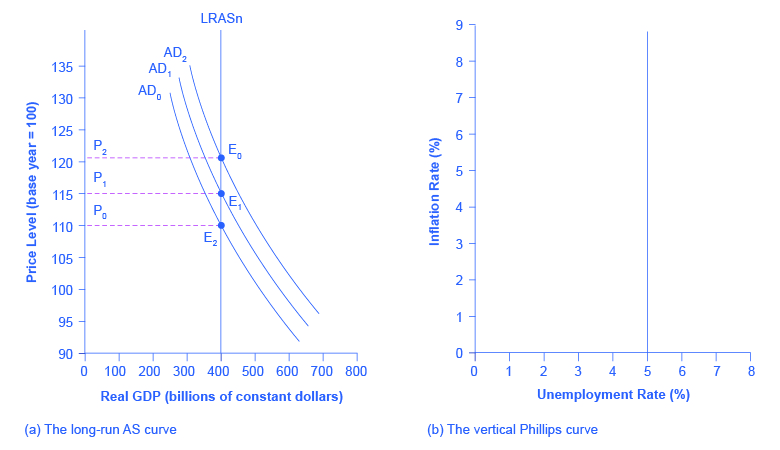
The Keynesian Perspective introduced the Phillips curve    and explained how it is derived from the aggregate supply curve. The short run upward sloping aggregate supply curve implies a downward sloping Phillips curve; thus, there is a tradeoff between inflation and unemployment in the short run. By contrast, a neoclassical long-run aggregate supply curve will imply a vertical shape for the Phillips curve, indicating no long run tradeoff between inflation and unemployment. [link] (a) shows the vertical AS curve, with three different levels of aggregate demand, resulting in three different equilibria, at three different price levels. At every point along that vertical AS curve, potential GDP and the rate of unemployment remains the same. Assume that for this economy, the natural rate of unemployment is 5%. As a result, the long-run Phillips curve relationship, shown in [link] (b), is a vertical line, rising up from 5% unemployment, at any level of inflation. Read the following Work It Out feature for additional information on how to interpret inflation and unemployment rates.

From a long-run as curve to a long-run phillips curve

The graph shows three aggregate demand curves that all intersect with the vertical potential GDP line at 400 on the x-axis. Line AD0 intersects at (110, 400); line AD1 intersects at (115, 400); and line AD2 intersects at (120, 400).
(a) With a vertical LRAS curve, shifts in aggregate demand do not alter the level of output but do lead to changes in the price level. Because output is unchanged between the equilibria E 0 , E 1 , and E 2 , all unemployment in this economy will be due to the natural rate of unemployment. (b) If the natural rate of unemployment is 5%, then the Phillips curve will be vertical. That is, regardless of changes in the price level, the unemployment rate remains at 5%.

Tracking inflation and unemployment rates

Suppose that you have collected data for years on the rates of inflation and unemployment and recorded them in a table, such as [link] . How do you interpret that information?

Year Inflation Rate Unemployment Rate
1970 2% 4%
1975 3% 3%
1980 2% 4%
1985 1% 6%
1990 1% 4%
1995 4% 2%
2000 5% 4%

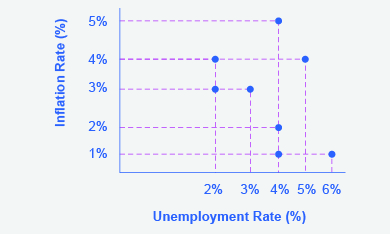
Step 1. Plot the data points in a graph with inflation rate on the vertical axis and unemployment rate on the horizontal axis. Your graph will appear similar to [link] .

Inflation rates

This graph shows several points of intersection between unemployment rates and inflation rates, one point for each year. Horizontal dashed lines extend from the y-axis at 5%, 4%, 3%, 2%, 1% and 5%. Vertical dashed lines extend from the x-axis at 2%, 3%, 4%, 6% and 4%. The points of intersection between these various lines are (2, 3); (3, 3), (4, 1); (4, 2); (4, 5); (6, 1); (5, 4).

Step 2. What patterns do you see in the data? You should notice that there are years when unemployment falls but inflation rises, and other years where unemployment rises and inflation falls.

Step 3. Can you determine the natural rate of unemployment from the data or from the graph? As you analyze the graph, it appears that the natural rate of unemployment lies at 4%; this is the rate that the economy appears to adjust back to after an apparent change in the economy. For example, in 1975 the economy appeared to have an increase in aggregate demand; the unemployment rate fell to 3% but inflation increased from 2% to 3%. By 1980, the economy had adjusted back to 4% unemployment and the inflation rate had returned to 2%. In 1985, the economy looks to have suffered a recession as unemployment rose to 6% and inflation fell to 1%. This would be consistent with a decrease in aggregate demand. By 1990, the economy recovered back to 4% unemployment, but at a lower inflation rate of 1%. In 1995 the economy again rebounded and unemployment fell to 2%, but inflation increased to 4%, which is consistent with a large increase in aggregate demand. The economy adjusted back to 4% unemployment but at a higher rate of inflation of 5%. Then in 2000, both unemployment and inflation increased to 5% and 4%, respectively.

Step 4. Do you see the Phillips curve(s) in the data? If we trace the downward sloping trend of data points, we could see a short-run Phillips curve that exhibits the inverse tradeoff between higher unemployment and lower inflation rates. If we trace the vertical line of data points, we could see a long-run Phillips curve at the 4% natural rate of unemployment.

Questions & Answers

Discuss the differences between taste and flavor, including how other sensory inputs contribute to our  perception of flavor.
John Reply
taste refers to your understanding of the flavor . while flavor one The other hand is refers to sort of just a blend things.
Faith
While taste primarily relies on our taste buds, flavor involves a complex interplay between taste and aroma
Kamara
which drugs can we use for ulcers
Ummi Reply
omeprazole
Kamara
what
Renee
what is this
Renee
is a drug
Kamara
of anti-ulcer
Kamara
Omeprazole Cimetidine / Tagament For the complicated once ulcer - kit
Patrick
what is the function of lymphatic system
Nency Reply
Not really sure
Eli
to drain extracellular fluid all over the body.
asegid
The lymphatic system plays several crucial roles in the human body, functioning as a key component of the immune system and contributing to the maintenance of fluid balance. Its main functions include: 1. Immune Response: The lymphatic system produces and transports lymphocytes, which are a type of
asegid
to transport fluids fats proteins and lymphocytes to the blood stream as lymph
Adama
what is anatomy
Oyindarmola Reply
Anatomy is the identification and description of the structures of living things
Kamara
what's the difference between anatomy and physiology
Oyerinde Reply
Anatomy is the study of the structure of the body, while physiology is the study of the function of the body. Anatomy looks at the body's organs and systems, while physiology looks at how those organs and systems work together to keep the body functioning.
AI-Robot
what is enzymes all about?
Mohammed Reply
Enzymes are proteins that help speed up chemical reactions in our bodies. Enzymes are essential for digestion, liver function and much more. Too much or too little of a certain enzyme can cause health problems
Kamara
yes
Prince
how does the stomach protect itself from the damaging effects of HCl
Wulku Reply
little girl okay how does the stomach protect itself from the damaging effect of HCL
Wulku
it is because of the enzyme that the stomach produce that help the stomach from the damaging effect of HCL
Kamara
function of digestive system
Ali Reply
function of digestive
Ali
the diagram of the lungs
Adaeze Reply
what is the normal body temperature
Diya Reply
37 degrees selcius
Xolo
37°c
Stephanie
please why 37 degree selcius normal temperature
Mark
36.5
Simon
37°c
Iyogho
the normal temperature is 37°c or 98.6 °Fahrenheit is important for maintaining the homeostasis in the body the body regular this temperature through the process called thermoregulation which involves brain skin muscle and other organ working together to maintain stable internal temperature
Stephanie
37A c
Wulku
what is anaemia
Diya Reply
anaemia is the decrease in RBC count hemoglobin count and PVC count
Eniola
what is the pH of the vagina
Diya Reply
how does Lysin attack pathogens
Diya
acid
Mary
I information on anatomy position and digestive system and there enzyme
Elisha Reply
anatomy of the female external genitalia
Muhammad Reply
Organ Systems Of The Human Body (Continued) Organ Systems Of The Human Body (Continued)
Theophilus Reply
what's lochia albra
Kizito
Got questions? Join the online conversation and get instant answers!
Jobilize.com Reply

Get Jobilize Job Search Mobile App in your pocket Now!

Get it on Google Play Download on the App Store Now


Source:  OpenStax, Macroeconomics. OpenStax CNX. Jun 16, 2014 Download for free at http://legacy.cnx.org/content/col11626/1.10
Google Play and the Google Play logo are trademarks of Google Inc.

Notification Switch

Would you like to follow the 'Macroeconomics' conversation and receive update notifications?

Ask