<< Chapter < Page Chapter >> Page >
This module covers Permutations and Combinations

Some counting rules

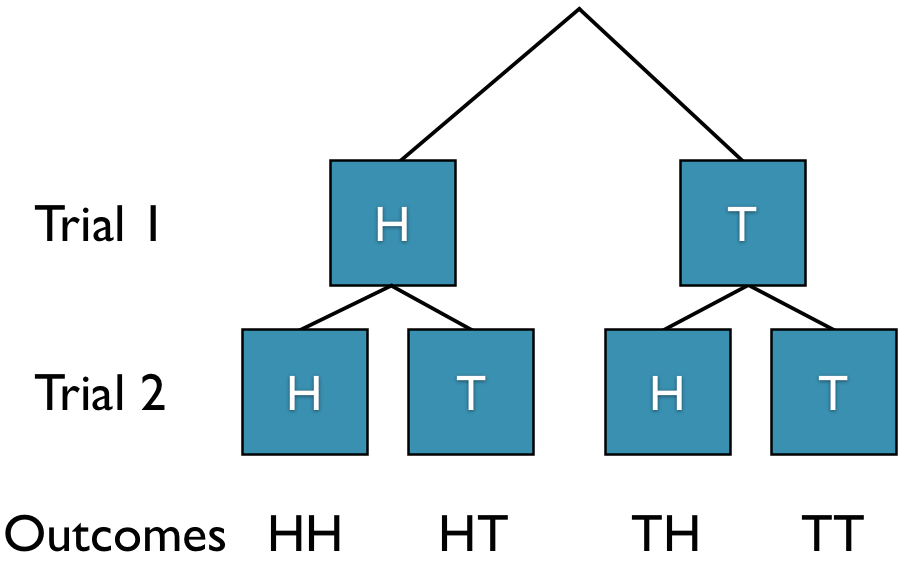
Instead of writing out all possible outcomes for an experiment, we can quickly find the total number of possible outcomes. We have already discussed that when tossing a coin twice, there are two trials which result in 4 different outcomes (S = {HH, HT, TH, TT}). We can use a tree diagram to represent this in the figure below.

Tree diagram representing toss of coin twice

For tossing the coin 3 times, we get 8 possible outcomes S = { HHH, HHT, HTH, HTT, THH, THT, TTH, TTT }. The tree diagram is displayed below.

Tree diagram representing three tosses of coin

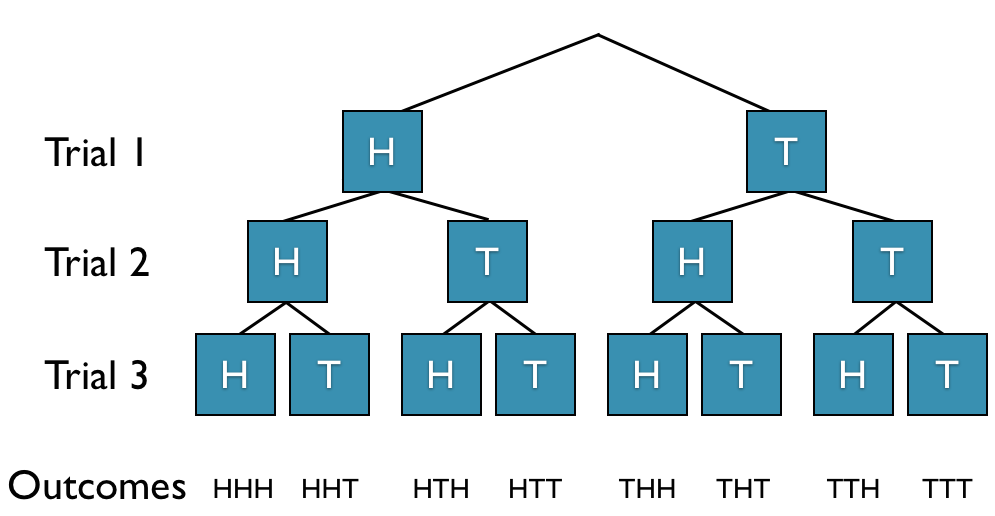
From the tree diagram we can see that the number of outcomes increases by a factor of 2 with each trial.

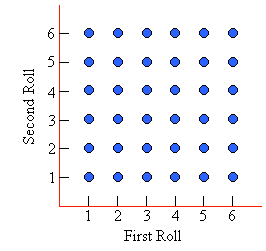
A die is rolled twice.

  1. How many possible outcomes are there?
  2. Write out the sample space.

  1. There are 6 possible outcomes for the first role and 6 possible outcomes for the second role.

    6 6 possible outcomes

  2. The figure below is a visual aid of the possible outcomes. For example, you could get “1” on the first roll and “2” on the second roll. This is a different outcome fromgetting “2” on the first roll and “1” on the second roll.
    Visual aid for rolls of two dice
    sample space for two dice

The multiplicative rule

A quick way to get the total number of possible outcomes without writing out the sample space or creating a visual aid is to multiply the number of possible outcomes for each trial.

When tossing a coin twice, there are two possible outcomes for each trial (H,T) regardless of whether the coin is weighted or not. If we multiply the two outcomes for the first trial and the two outcomes for the second trial we get 2 2 4 possible outcomes. S = { HH, HT, TH, TT }.

When tossing a coin three times, there are two possible outcomes for each trial (H,T) and we end up with 8 possible outcomes. From the tree diagram we saw that we get S = { HHH, HHT, HTH, HTT, THH, THT, TTH, TTT }.

2 2 2 8

We can extend this concept to tossing a coin 4 times where there are 16 possible outcomes. We will leave it up to you to write out the sample space.

2 2 2 2 16

Try it

You are going to toss a coin and roll a die.

  1. Calculate the number of possible outcomes if you toss the coin once and roll the die once.
  2. Calculate the number of possible outcomes if you toss the coin twice and roll the die once.
  3. Calculate the number of possible outcomes if you toss the coin twice and roll the die twice.
  1. There are 2 possible outcomes for tossing the die and 6 possible outcomes for rolling the die. 2 6 12
  2. 2 2 6 24
  3. 2 2 6 6 72

Suppose we wish to arrange four pictures in a row along a wall. How many different outcomes are possible?

There are four pictures that can be selected for the first position on the wall. If we choose one picture to hang first, we are now left with three choices of pictures for the next position on the wall. Using the multiplicative rule, there are 4 3 12 possible arrangements of pictures for the first two positions on the wall. If we continue with this procedure, we now only have two pictures to choose from for the third position and the last picture goes in the last position. As a result, there are 24 possible arrangements of the pictures in a row along a wall.

Questions & Answers

differentiate between demand and supply giving examples
Lambiv Reply
differentiated between demand and supply using examples
Lambiv
what is labour ?
Lambiv
how will I do?
Venny Reply
how is the graph works?I don't fully understand
Rezat Reply
information
Eliyee
devaluation
Eliyee
t
WARKISA
hi guys good evening to all
Lambiv
multiple choice question
Aster Reply
appreciation
Eliyee
explain perfect market
Lindiwe Reply
In economics, a perfect market refers to a theoretical construct where all participants have perfect information, goods are homogenous, there are no barriers to entry or exit, and prices are determined solely by supply and demand. It's an idealized model used for analysis,
Ezea
What is ceteris paribus?
Shukri Reply
other things being equal
AI-Robot
When MP₁ becomes negative, TP start to decline. Extuples Suppose that the short-run production function of certain cut-flower firm is given by: Q=4KL-0.6K2 - 0.112 • Where is quantity of cut flower produced, I is labour input and K is fixed capital input (K-5). Determine the average product of lab
Kelo
Extuples Suppose that the short-run production function of certain cut-flower firm is given by: Q=4KL-0.6K2 - 0.112 • Where is quantity of cut flower produced, I is labour input and K is fixed capital input (K-5). Determine the average product of labour (APL) and marginal product of labour (MPL)
Kelo
yes,thank you
Shukri
Can I ask you other question?
Shukri
what is monopoly mean?
Habtamu Reply
What is different between quantity demand and demand?
Shukri Reply
Quantity demanded refers to the specific amount of a good or service that consumers are willing and able to purchase at a give price and within a specific time period. Demand, on the other hand, is a broader concept that encompasses the entire relationship between price and quantity demanded
Ezea
ok
Shukri
how do you save a country economic situation when it's falling apart
Lilia Reply
what is the difference between economic growth and development
Fiker Reply
Economic growth as an increase in the production and consumption of goods and services within an economy.but Economic development as a broader concept that encompasses not only economic growth but also social & human well being.
Shukri
production function means
Jabir
What do you think is more important to focus on when considering inequality ?
Abdisa Reply
any question about economics?
Awais Reply
sir...I just want to ask one question... Define the term contract curve? if you are free please help me to find this answer 🙏
Asui
it is a curve that we get after connecting the pareto optimal combinations of two consumers after their mutually beneficial trade offs
Awais
thank you so much 👍 sir
Asui
In economics, the contract curve refers to the set of points in an Edgeworth box diagram where both parties involved in a trade cannot be made better off without making one of them worse off. It represents the Pareto efficient allocations of goods between two individuals or entities, where neither p
Cornelius
In economics, the contract curve refers to the set of points in an Edgeworth box diagram where both parties involved in a trade cannot be made better off without making one of them worse off. It represents the Pareto efficient allocations of goods between two individuals or entities,
Cornelius
Suppose a consumer consuming two commodities X and Y has The following utility function u=X0.4 Y0.6. If the price of the X and Y are 2 and 3 respectively and income Constraint is birr 50. A,Calculate quantities of x and y which maximize utility. B,Calculate value of Lagrange multiplier. C,Calculate quantities of X and Y consumed with a given price. D,alculate optimum level of output .
Feyisa Reply
Answer
Feyisa
c
Jabir
the market for lemon has 10 potential consumers, each having an individual demand curve p=101-10Qi, where p is price in dollar's per cup and Qi is the number of cups demanded per week by the i th consumer.Find the market demand curve using algebra. Draw an individual demand curve and the market dema
Gsbwnw Reply
suppose the production function is given by ( L, K)=L¼K¾.assuming capital is fixed find APL and MPL. consider the following short run production function:Q=6L²-0.4L³ a) find the value of L that maximizes output b)find the value of L that maximizes marginal product
Abdureman
types of unemployment
Yomi Reply
What is the difference between perfect competition and monopolistic competition?
Mohammed
Got questions? Join the online conversation and get instant answers!
Jobilize.com Reply
Practice Key Terms 3

Get Jobilize Job Search Mobile App in your pocket Now!

Get it on Google Play Download on the App Store Now


Source:  OpenStax, Introduction to statistics i - stat 213 - university of calgary - ver2015revb. OpenStax CNX. Oct 21, 2015 Download for free at http://legacy.cnx.org/content/col11874/1.3
Google Play and the Google Play logo are trademarks of Google Inc.

Notification Switch

Would you like to follow the 'Introduction to statistics i - stat 213 - university of calgary - ver2015revb' conversation and receive update notifications?

Ask