<< Chapter < Page
  Digital signal processing - dsp     Page 6 / 15
Chapter >> Page >

How can we compute the array response?

This is where Fourier transforms come into play. We could compute the response of our one-dimensional array for waves propagating along the length ofthe wire by treating the elements of the array as samples in space and performing a one-dimensional Fourier transform on the elements of the array.

A sampled space series

In this case, we would consider the array elements to constitute samples taken in space in the same way that we consider a sampled time series toconstitute samples taken in time. In other words, the array elements constitute a sampled space series. The Fourier transform of a sampled time series is thefrequency spectrum of the time series. The Fourier transform of a sampled space series is the wavenumber spectrum of the space series.

Three example wavenumber spectra

To set the stage for what we will be seeing later, Figure 2 depicts three different two-element arrays with different spacing in the three (black and white) images across the top of the figure. The wavenumber response for each of the three arrays is shown inthe three images in the bottom row of images in Figure 2 .

(In Figure 2 , the array elements are represented by the white dots on the black background.)
Figure 2. Three example wavenumber spectra.
missing image

Plots of 3D surfaces

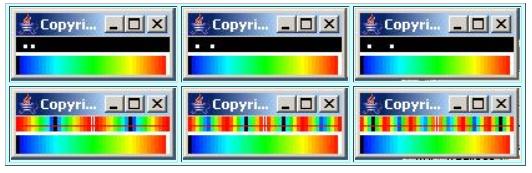
The images shown in Figure 2 were produced using the class named ImgMod29 , which I explained earlier in the module titled Plotting 3D Surfaces using Java . You can refer back to that module for a detailed explanation of the display format. Briefly, each of the sixindividual images in Figure 2 is a plot of a 3D surface, with the elevation of the surface at any particular point being indicated by the color at that pointbased on the colors on the calibration scale below each plot.

(The calibration scale is the strip that changes color in a smooth gradient from black through blue, cyan, green, yellow, red, and white with black at the leftend and white at the right end.

The three images in the top row of Figure 2 with the white dots on the black background represent the arrayelements for each of the three arrays. The three images in the bottom row of Figure 2 represent the wavenumber response of the corresponding arrays in the top row.)

Black, white, and the colors in between

The lowest (algebraic) elevation in the plot is colored black. Hence the backgrounds are black in the top three plots. The highest elevation is colored white. Thearray elements are white in the top three plots.

Between black and white, the elevation is given by the color scale below the plot with the lowest elevation on the left of the scale and the highestelevation on the right. Thus, a green elevation is about half way between the lowest and highest elevations. Blue elevations are near the low end. Redelevations are near the high end. Cyan and yellow elevations fall in between as shown by the calibration scale.

The maximum array output

All three wavenumber plots have a maximum response at the center, which is the zero wavenumber origin. In effect, this corresponds to infinite wavelength.If the wavelength is infinite, it doesn't matter what the separation between the elements is, they will all move up and down in unison and their electricaloutputs will add constructively to produce a maximum output.

Questions & Answers

it is the relatively stable flow of income
Chidubem Reply
what is circular flow of income
Divine Reply
branches of macroeconomics
SHEDRACK Reply
what is Flexible exchang rate?
poudel Reply
is gdp a reliable measurement of wealth
Atega Reply
introduction to econometrics
Husseini Reply
Hi
mostafa
hi
LEMLEM
hello
Sammol
hi
Mahesh
bi
Ruqayat
hi
Ruqayat
Hi fellas
Nyawa
hey
Sammol
hi
God
hello
Jahara
Good morning
Jorge
hi
abubakar
hi
Nmesoma
hi
Mahesh
Hi
Tom
Why is unemployment rate never zero at full employment?
Priyanka Reply
bcoz of existence of frictional unemployment in our economy.
Umashankar
what is flexible exchang rate?
poudel
due to existence of the pple with disabilities
Abdulraufu
the demand of a good rises, causing the demand for another good to fall
Rushawn Reply
is it possible to leave every good at the same level
Joseph
I don't think so. because check it, if the demand for chicken increases, people will no longer consume fish like they used to causing a fall in the demand for fish
Anuolu
is not really possible to let the value of a goods to be same at the same time.....
Salome
Suppose the inflation rate is 6%, does it mean that all the goods you purchase will cost 6% more than previous year? Provide with reasoning.
Geetha Reply
Not necessarily. To measure the inflation rate economists normally use an averaged price index of a basket of certain goods. So if you purchase goods included in the basket, you will notice that you pay 6% more, otherwise not necessarily.
Waeth
discus major problems of macroeconomics
Alii Reply
what is the problem of macroeconomics
Yoal
Economic growth Stable prices and low unemployment
Ephraim
explain inflationcause and itis degre
Miresa Reply
what is inflation
Getu
increase in general price levels
WEETO
Good day How do I calculate this question: C= 100+5yd G= 2000 T= 2000 I(planned)=200. Suppose the actual output is 3000. What is the level of planned expenditures at this level of output?
Chisomo Reply
how to calculate actual output?
Chisomo
how to calculate the equilibrium income
Beshir
Criteria for determining money supply
Thapase Reply
who we can define macroeconomics in one line
Muhammad
Aggregate demand
Mohammed
C=k100 +9y and i=k50.calculate the equilibrium level of output
Mercy Reply
Hi
Isiaka
Hi
Geli
hy
Man
👋
Bahunda
hy how are you?
Man
ys
Amisha
how are you guys
Sekou
f9 guys
Amisha
how are you guys
Sekou
ys am also fine
Amisha
fine and you guys
Geli
from Nepal
Amisha
nawalparasi district from belatari
Amisha
nd u
Amisha
I am Camara from Guinea west Africa... happy to meet you guys here
Sekou
ma management ho
Amisha
ahile becheclor ho
Amisha
hjr ktm bta ho ani k kaam grnu hunxa tw
Amisha
belatari
Amisha
1st year ho
Amisha
nd u
Amisha
ahh
Amisha
kaha biratnagar
Amisha
ys
Amisha
kina k vo
Amisha
money as unit of account means what?
Kalombe
A unit of account is something that can be used to value goods and services and make calculations
Jim
all of you please speak in English I can't understand you're language
Muhammad
I want to know how can we define macroeconomics in one line
Muhammad
it must be .9 or 0.9 no Mpc is greater than 1 Y=100+.9Y+50 Y-.9Y=150 0.1Y/0.1=150/0.1 Y=1500
Kalombe
Mercy is it clear?😋
Kalombe
hi can someone help me on this question If a negative shocks shifts the IS curve to the left, what type of policy do you suggest so as to stabilize the level of output? discuss your answer using appropriate graph.
Galge Reply
if interest rate is increased this will will reduce the level of income shifting the curve to the left ◀️
Kalombe
Got questions? Join the online conversation and get instant answers!
Jobilize.com Reply

Get Jobilize Job Search Mobile App in your pocket Now!

Get it on Google Play Download on the App Store Now


Source:  OpenStax, Digital signal processing - dsp. OpenStax CNX. Jan 06, 2016 Download for free at https://legacy.cnx.org/content/col11642/1.38
Google Play and the Google Play logo are trademarks of Google Inc.

Notification Switch

Would you like to follow the 'Digital signal processing - dsp' conversation and receive update notifications?

Ask