

| << Chapter < Page | Chapter >> Page > |
The preference indicated by this study is consistent with the Fisherian model ( [link] ) of female preference, first proposed by Fisher in 1930 (Kodric-Brown 1984). Because the vocal displays of the males are sexually selected and heritable, the Fisherian model predicts that females who mate with the dominant males may actually increase the fitness of their offspring by other indirect means such as “attractive” genes that caused the female to mate with the male on lek. Because the display behavior of the males is determined at least in part by the males’ natural abilities and instincts, female preference for males that show this behavior serves to increase the fitness benefits and mating success of the offspring (Durães et al. 2009).
Another theory on lekking behavior is known as the “hotspot” hypothesis. This theory proposes that leks form as an aggregation of males each settling in an area where females are most likely to pass by (Théry 1991). Thus, male clusters are expected to occur in regions of high female density or in regions determined likely to encounter females based on studies of female dispersion patterns (Westcott 1994). While perhaps less supported than the preference model, the hotspot model is appealing to many scientists as a result of its congruity with generally-accepted knowledge of the fundamentals of mating systems. Leks provide an opportunity to study mating fundamentals, because in leks, males contribute only sperm and are therefore able to act solely out of concern for maximum reproductive success without the confound of providing parental care to offspring. Logically, then, the hotspot hypothesis of leks is a natural phenomenon of male behavior as a function of female behavior, which is to be expected in a mating system where males are focused solely on genetic distribution (Westcott 1994).
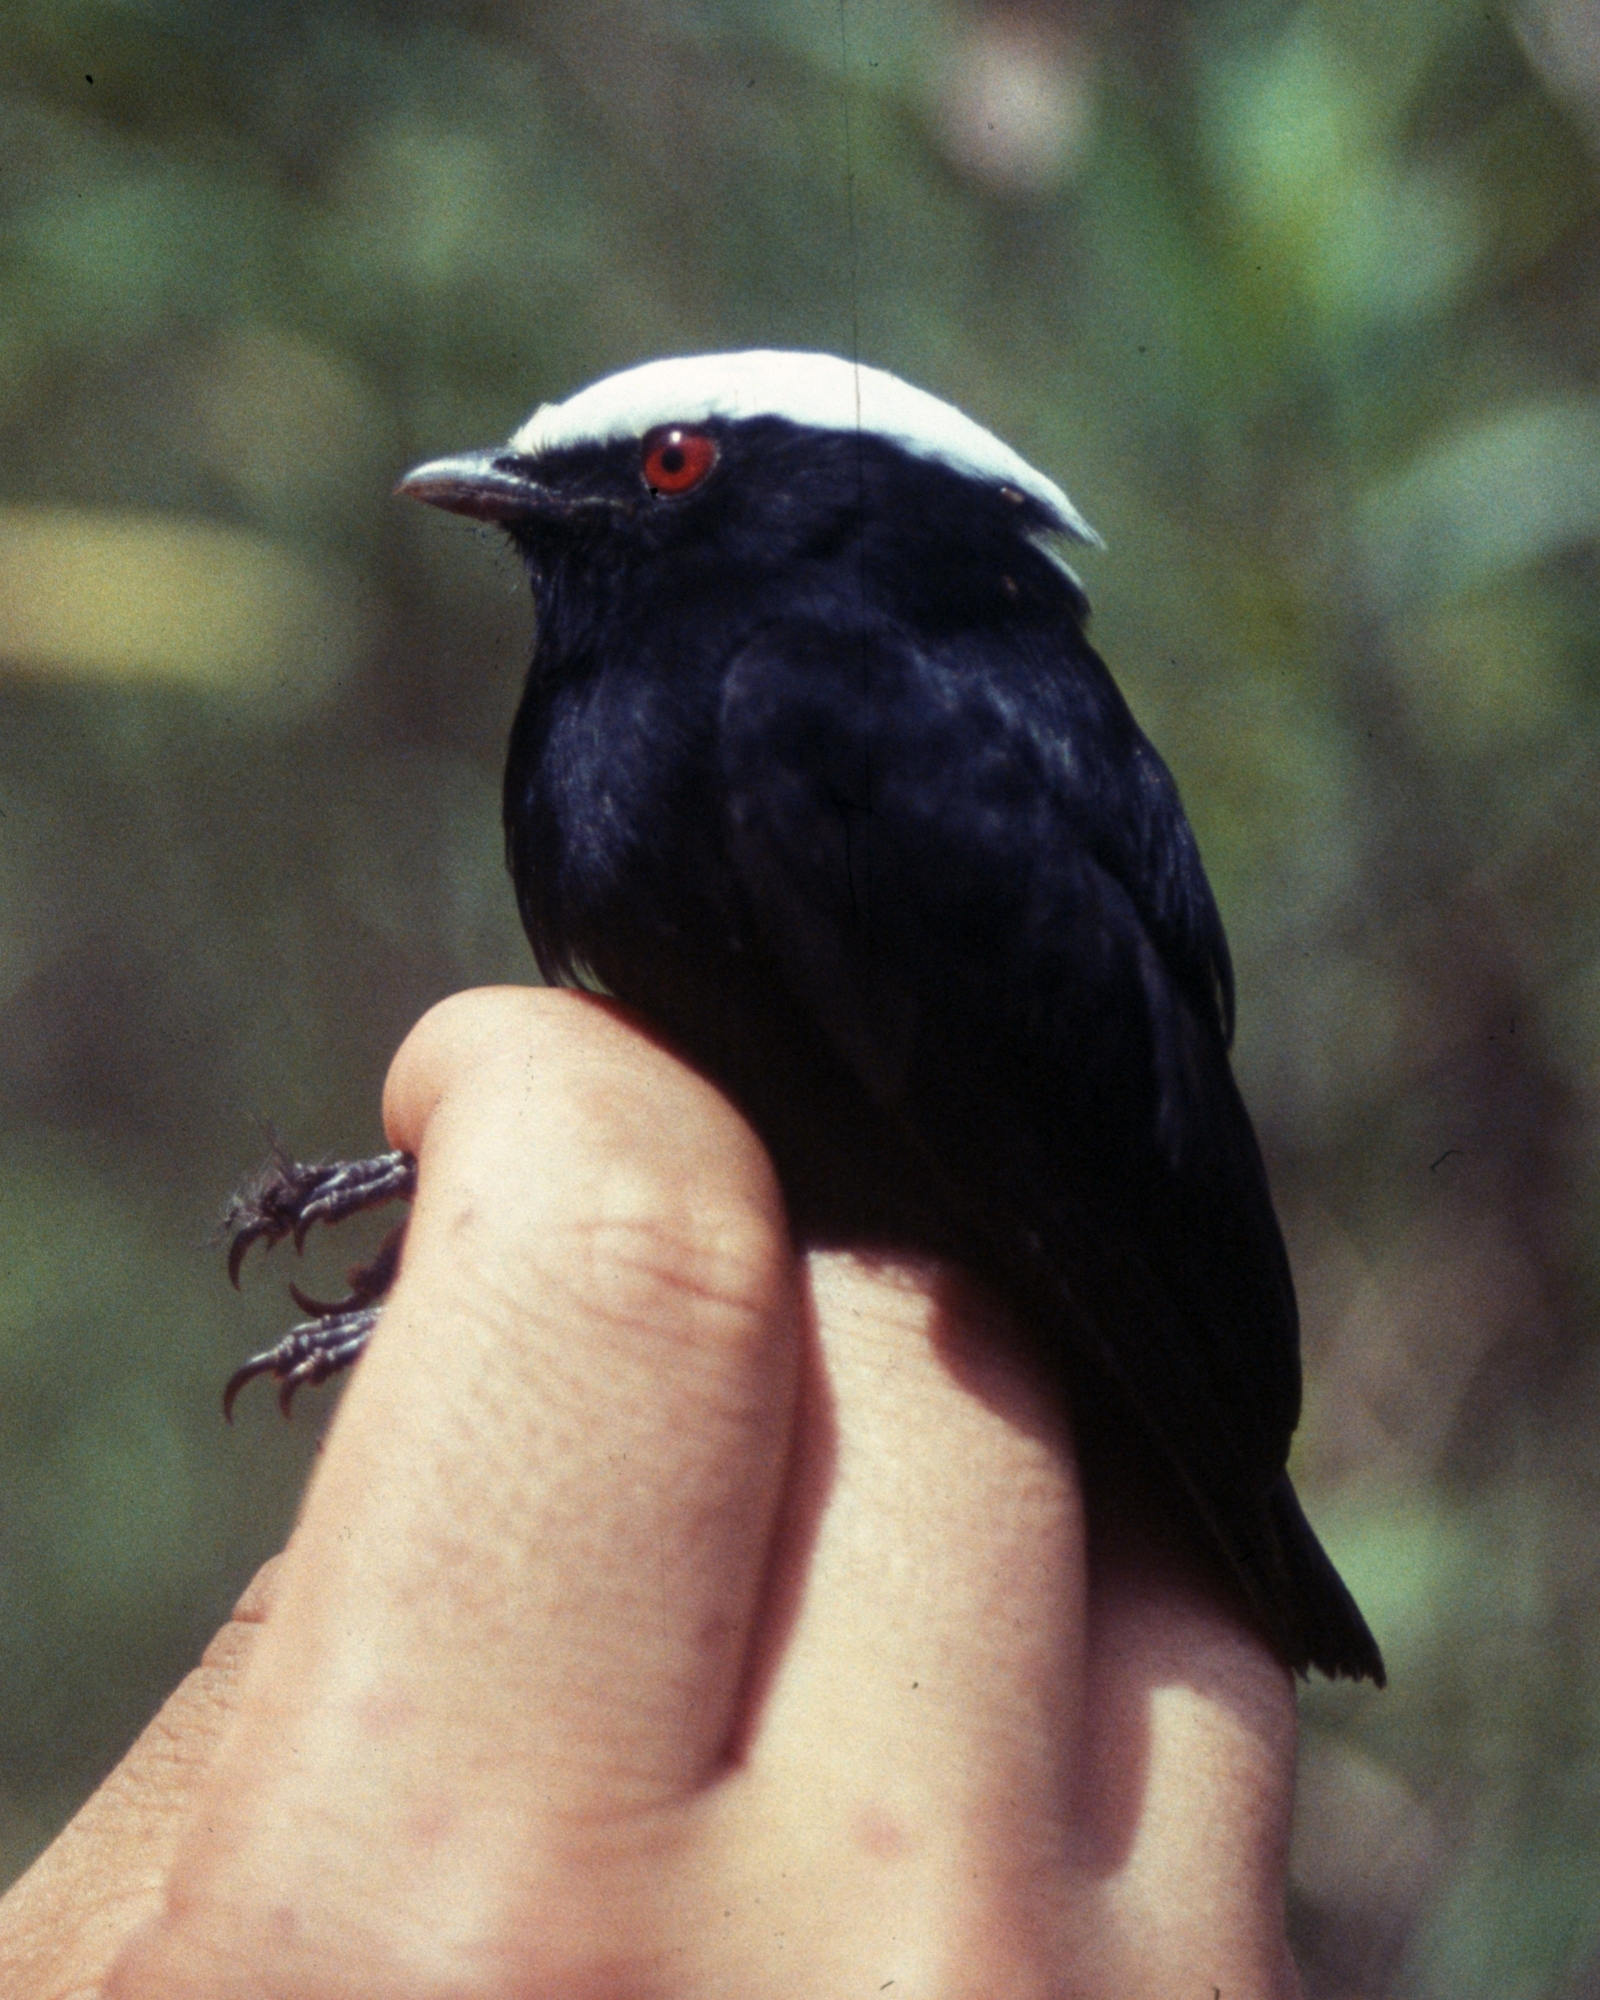
The manakins (Pipridae) are a group of approximately 40 different Neotropical bird species characterized partially by their lekking behavior (Prum 1990, Théry 1991). Sympatric manakin species demonstrate various distributions of clustering, but lekking display to some degree is present in all manakin species (Théry 1991, Prum 1990). Manakins are noted and selected for their bright plumage displays, and thus sexual selection has led to strong dimorphism in male characteristics (Prum 1990). Male birds are selected for bold, bright patterns of black and white with very bright colors while females are more camouflaged in greens and yellow. Manakins are traditionally frugivorous , feeding on fruits similar to other tropical birds. Manakin displays tend to vary among species. Some display on tree branches and limbs while others perform their mating dances on fallen logs or in cleared patches. Behaviors also vary in complexity, which many species demonstrating simple callings and flights while others show orchestrated wing noises, postures, flights, and patterns (Prum 1990).

A study by Marc Théry in French Guiana followed six species of manakins, white-crowned ( Pipra pipra pipra ), golden-headed ( P. erythrocephala erythrocephala ), white-fronted ( P. serena serena ), white-bearded ( Manacus manacus manacus , white-throated ( Corapipo gutturalis ), and thrush-like ( Schiffornis turdinus wallacii ) for 3 years, banding them and studying mating and breeding behaviors as well as movement patterns (Théry 1991). The researchers found that the female manakins stayed within their home ranges when courting and visiting males. Additionally, the location of the leks was always near regions of climaxing feeding activity of females. When studying the ranges of different females, researchers noted that females visiting males on the same lek showed overlapping home ranges and the male manakins were found to settle in regions of high resource density, where female traffic was highest. These observations show strong support for the hotspot theory, with males aggregating in “hotspots,” or regions that attract high densities of females (Théry 1991).
Notification Switch
Would you like to follow the 'Mockingbird tales: readings in animal behavior' conversation and receive update notifications?

|
|

|
|

|
|

|
|

|
|
|
|
|
|
|
|

|
|

|
|

|