<< Chapter < Page Chapter >> Page >

As the activity shows, one can map the magnetic field of a magnet by placing it underneath a piece of paper and sprinklingiron filings on top. The iron filings line themselves up parallel to the magnetic field.

Investigation : field around a pair of bar magnets

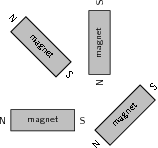
Take two bar magnets and place them a short distance apart such that they are repellingeach other. Place a sheet of white paper over the bar magnets and sprinkle some iron filings onto the paper. Give the paper a shaketo evenly distribute the iron filings. In your workbook, draw both the bar magnets and the pattern formed by the iron filings. Repeatthe procedure for two bar magnets attracting each other and draw what the pattern looks like for this situation. Make a note of theshape of the lines formed by the iron filings, as well as their size and their direction for both arrangements of the bar magnet.What does the pattern look like when you place both bar magnets side by side?

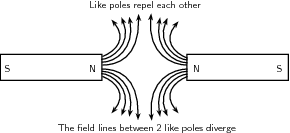
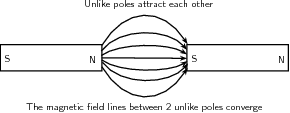
As already said, opposite poles of a magnet attract each other and bringing them together causes their magnetic field lines to converge (come together). Like poles of a magnet repel each other and bringing them together causes their magnetic field lines to diverge (bend out from each other).

Ferromagnetism and retentivity

Ferromagnetism is a phenomenon shown by materials like iron, nickel or cobalt.These materials can form permanent magnets. They always magnetise so as to be attracted to a magnet, no matter whichmagnetic pole is brought toward the unmagnetised iron/nickel/cobalt.

The ability of a ferromagnetic material to retain its magnetisation after an external field is removed is called its retentivity .

Paramagnetic materials are materials like aluminium or platinum, which become magnetised in an externalmagnetic field in a similar way to ferromagnetic materials. However, they lose their magnetism when the external magnetic field is removed.

Diamagnetism is shown by materials like copper or bismuth, which become magnetised in a magnetic field with a polarity opposite to the external magnetic field. Unlike iron, they are slightly repelled by a magnet.

The compass and the earth's magnetic field

A compass is an instrument which is used to find the direction of a magneticfield. A compass consists of a small metal needle which is magnetised itself and which is free to turn in any direction.Therefore, when in the presence of a magnetic field, the needle is able to line up in the same direction as the field.

Interesting fact

Lodestone, a magnetised form of iron-oxide, was found to orientate itself in a north-south direction if left free to rotate by suspensionon a string or on a float in water. Lodestone was therefore used as an early navigational compass.

Compasses are mainly used in navigation to find direction on the earth. This works becausethe earth itself has a magnetic field which is similar to that of a bar magnet (see the picture below). The compass needle aligns with the earth's magnetic fielddirection and points north-south. Once you know where north is, you can figure out any other direction. A picture of a compass is shown below:

Questions & Answers

differentiate between demand and supply giving examples
Lambiv Reply
differentiated between demand and supply using examples
Lambiv
what is labour ?
Lambiv
how will I do?
Venny Reply
how is the graph works?I don't fully understand
Rezat Reply
information
Eliyee
devaluation
Eliyee
t
WARKISA
hi guys good evening to all
Lambiv
multiple choice question
Aster Reply
appreciation
Eliyee
explain perfect market
Lindiwe Reply
In economics, a perfect market refers to a theoretical construct where all participants have perfect information, goods are homogenous, there are no barriers to entry or exit, and prices are determined solely by supply and demand. It's an idealized model used for analysis,
Ezea
What is ceteris paribus?
Shukri Reply
other things being equal
AI-Robot
When MP₁ becomes negative, TP start to decline. Extuples Suppose that the short-run production function of certain cut-flower firm is given by: Q=4KL-0.6K2 - 0.112 • Where is quantity of cut flower produced, I is labour input and K is fixed capital input (K-5). Determine the average product of lab
Kelo
Extuples Suppose that the short-run production function of certain cut-flower firm is given by: Q=4KL-0.6K2 - 0.112 • Where is quantity of cut flower produced, I is labour input and K is fixed capital input (K-5). Determine the average product of labour (APL) and marginal product of labour (MPL)
Kelo
yes,thank you
Shukri
Can I ask you other question?
Shukri
what is monopoly mean?
Habtamu Reply
What is different between quantity demand and demand?
Shukri Reply
Quantity demanded refers to the specific amount of a good or service that consumers are willing and able to purchase at a give price and within a specific time period. Demand, on the other hand, is a broader concept that encompasses the entire relationship between price and quantity demanded
Ezea
ok
Shukri
how do you save a country economic situation when it's falling apart
Lilia Reply
what is the difference between economic growth and development
Fiker Reply
Economic growth as an increase in the production and consumption of goods and services within an economy.but Economic development as a broader concept that encompasses not only economic growth but also social & human well being.
Shukri
production function means
Jabir
What do you think is more important to focus on when considering inequality ?
Abdisa Reply
any question about economics?
Awais Reply
sir...I just want to ask one question... Define the term contract curve? if you are free please help me to find this answer 🙏
Asui
it is a curve that we get after connecting the pareto optimal combinations of two consumers after their mutually beneficial trade offs
Awais
thank you so much 👍 sir
Asui
In economics, the contract curve refers to the set of points in an Edgeworth box diagram where both parties involved in a trade cannot be made better off without making one of them worse off. It represents the Pareto efficient allocations of goods between two individuals or entities, where neither p
Cornelius
In economics, the contract curve refers to the set of points in an Edgeworth box diagram where both parties involved in a trade cannot be made better off without making one of them worse off. It represents the Pareto efficient allocations of goods between two individuals or entities,
Cornelius
Suppose a consumer consuming two commodities X and Y has The following utility function u=X0.4 Y0.6. If the price of the X and Y are 2 and 3 respectively and income Constraint is birr 50. A,Calculate quantities of x and y which maximize utility. B,Calculate value of Lagrange multiplier. C,Calculate quantities of X and Y consumed with a given price. D,alculate optimum level of output .
Feyisa Reply
Answer
Feyisa
c
Jabir
the market for lemon has 10 potential consumers, each having an individual demand curve p=101-10Qi, where p is price in dollar's per cup and Qi is the number of cups demanded per week by the i th consumer.Find the market demand curve using algebra. Draw an individual demand curve and the market dema
Gsbwnw Reply
suppose the production function is given by ( L, K)=L¼K¾.assuming capital is fixed find APL and MPL. consider the following short run production function:Q=6L²-0.4L³ a) find the value of L that maximizes output b)find the value of L that maximizes marginal product
Abdureman
types of unemployment
Yomi Reply
What is the difference between perfect competition and monopolistic competition?
Mohammed
Got questions? Join the online conversation and get instant answers!
Jobilize.com Reply

Get Jobilize Job Search Mobile App in your pocket Now!

Get it on Google Play Download on the App Store Now


Source:  OpenStax, Physics - grade 10 [caps 2011]. OpenStax CNX. Jun 14, 2011 Download for free at http://cnx.org/content/col11298/1.3
Google Play and the Google Play logo are trademarks of Google Inc.

Notification Switch

Would you like to follow the 'Physics - grade 10 [caps 2011]' conversation and receive update notifications?

Ask