<< Chapter < Page
  From matlab and simulink to real     Page 3 / 3
Chapter >> Page >

Select View ->Library Browser ->Signal Processing Blockset ->Filtering->Adaptive Filters.

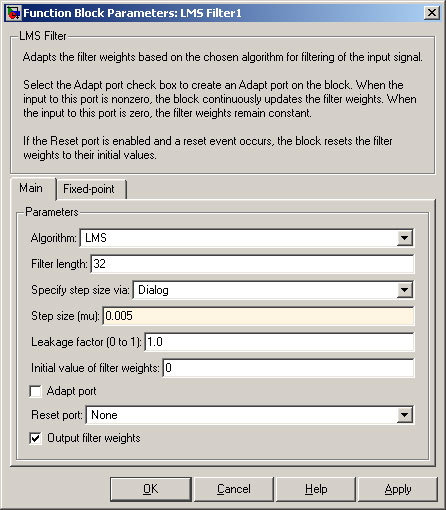
Highlight “Adaptive Filters”. Drag-and-drop the “LMS Filter” block onto the model.

Adding an LMS Filter Block

Setting the lms filter parameters

The most critical variable in an LMS filter is the “Step size (mu)”.

If “mu” is too small, the filter has very fine resolution, but reacts too slowly to the audio signal.

If “mu” is too great, the filter reacts very quickly, but the error also remains large.

We will start with 0.005.

Setting the Parameter “Set size (mu)”

Adding a delay

From the “Signal Processing Blockset”, highlight “Signal Operations”. Drag-and-drop the “Delay” Since we are working with frames, the delay from “Discrete Components” library will not work! block onto the model.

Adding a Delay

Setting the delay parameters

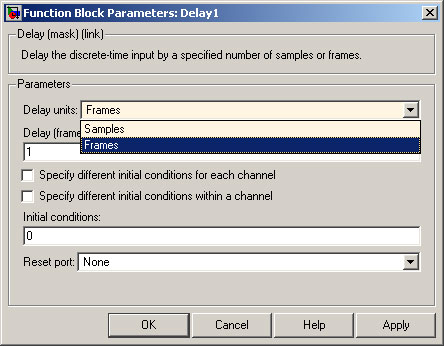
Because we are working with frames of 64 samples, it is convenient configure the delay using frames. Double-click on the “Delay” block.

Change the “Delay units” to Frames.

Set the “Delay (frames)” to 1. This makes the delay 64 samples.

Setting the Delay Size

Adding a dip switch and led

So we can hear the difference without LMS denoising and with LMS noise reduction, we will use a DIP switch of the DSK6713.

Adding a Switch and LED

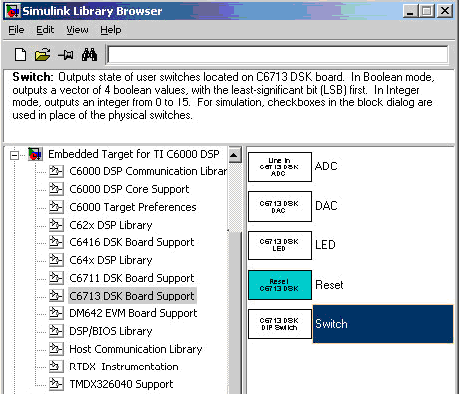
Select View ->Library Browser ->Embedded Target for TI C6000 DSP. Highlight “DSK6713 Board Support”.

Drag-and-drop the “Switch” block onto the model. Also drag-and-drop the “LED” block onto the model.

Dip switch settings

The DIP switch needs to be configured. Double-click on the “Switch” block.

Select all the boxes and set “Data type” to Integer. The “Sample time” should also be set to “–1”.

Setting up the DIP Switch Values

Adding a constant, switch and relational operator

We now need to setup a way to switch between straight through without noise reduction and with LMS noise reduction.

Select View ->Library Browser ->Simulink. Highlight “Commonly Used Blocks”.

Drag-and-drop a “Constant” onto the model.

Drag-and-drop a “Switch” block onto the model.

Drag-and-drop a “Relational Operator” block onto the model.

Selecting the Commonly Used Blocks

Setting the constant value

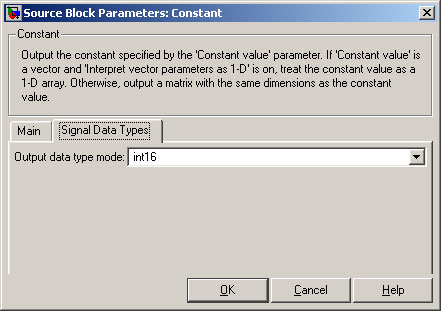
The switch values lie between 0 and 15. We will use switch values 0 and 1. Double-click on the “Constant” block. Set the “Constant value” to 1 and the “Sample time” to “inf”.

Setting the Echo Delay Gain

Setting the constant data type

Click on the “Signal Data Types” tab. Set the “Output data type mode” to “int16”. This is compatible with the DAC on the DSK6713.

Data Type Conversion to 16-bit Integer

Setting the relational operator type

Double click on the “Relational Operator” block. Change the “Relational operator” to “==”. Click on the “Signal Data Types” tab.

Changing the Relational Operator

Setting the relational operator data type

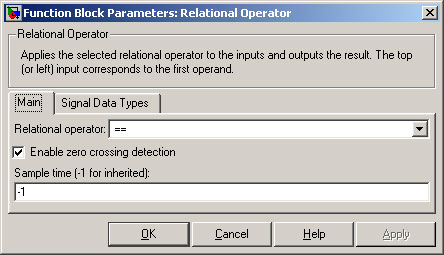
Set the “Output data type mode” to “Boolean”. Click on “OK”.

Changing the Output Data Type

Joining the blocks

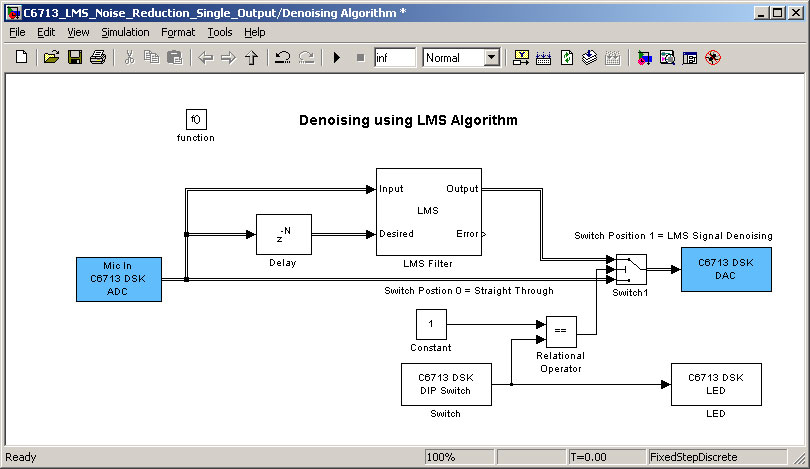
Move the blocks and join them as shown in the Figure below.

Joining the Blocks

Returning to the parent system

From the Toolbar, select the “Up Arrow” icon. This returns you to the next higher level.

Returning to the Parent System

Building the model

Selecting real-time workshop

Select Tools ->Real-Time Workshop ->Build Model.

Building the Model

Frames displayed on model

When built, the single lines are replaced by double lines. This shows frames.

Frames

The completed model running on code composer studio

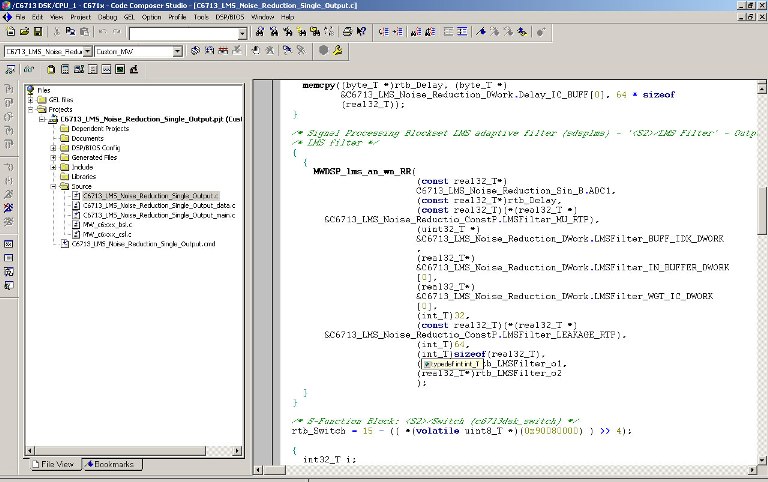
From the folders on the left, select the source code for the project.

The Completed Model Running in Code Composer Studio

Different settings on the dsk6713

Microphone straight through to loudspeakers

To check out the microphone and loudspeakers, set the DIP switches on the DSK6713 as follows:

Switch Position 0

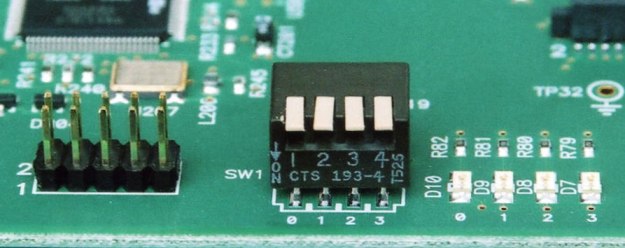
The microphone is fed directly to the loudspeakers. There is no LMS noise reduction.

Switch position for lms noise reduction

To run the “LMS Noise Reduction” subsystem, set the DIP switch to 1.

Switch Position 1 for LMS Noise Reduction

Some things to try

You may wish to experiment with different settings. Here are some suggestions.

Experiment with lms filter settings

Change the value of “Step size (mu)” between 0.0001 and 0.5. This is the critical value.

Low values of mu give good resolution, but a slow reaction time.

High values of mu give less resolution, but faster reaction times.

Find the best value of mu for noise reduction on the TI DSK6713.

Configuring the LMS Filter Block Parameter

Experiment with lms filter settings

Try different value of “Filter Length”. What is the minimum value that will allow the filter to work correctly?

Change from lms filter to rls filter

Inside the “Adaptive Filters” are different LMS types. Which are suitable for LMS denoising and which are not?
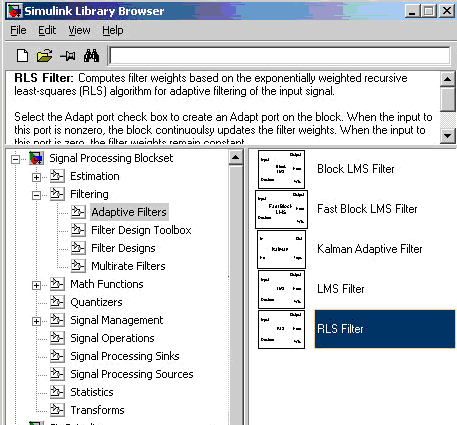
Available Adaptive Filter Types

Figure 40 –

MATLAB and Simulink are registered trademarks of The MathWorks, Inc. See www.mathworks.com/trademarks for a list of additional trademarks. Other product or brand names may be trademarks or registered trademarks of their respective holders.

Questions & Answers

What are the factors that affect demand for a commodity
Florence Reply
differentiate between demand and supply giving examples
Lambiv Reply
differentiated between demand and supply using examples
Lambiv
what is labour ?
Lambiv
how will I do?
Venny Reply
how is the graph works?I don't fully understand
Rezat Reply
information
Eliyee
devaluation
Eliyee
t
WARKISA
hi guys good evening to all
Lambiv
multiple choice question
Aster Reply
appreciation
Eliyee
explain perfect market
Lindiwe Reply
In economics, a perfect market refers to a theoretical construct where all participants have perfect information, goods are homogenous, there are no barriers to entry or exit, and prices are determined solely by supply and demand. It's an idealized model used for analysis,
Ezea
What is ceteris paribus?
Shukri Reply
other things being equal
AI-Robot
When MP₁ becomes negative, TP start to decline. Extuples Suppose that the short-run production function of certain cut-flower firm is given by: Q=4KL-0.6K2 - 0.112 • Where is quantity of cut flower produced, I is labour input and K is fixed capital input (K-5). Determine the average product of lab
Kelo
Extuples Suppose that the short-run production function of certain cut-flower firm is given by: Q=4KL-0.6K2 - 0.112 • Where is quantity of cut flower produced, I is labour input and K is fixed capital input (K-5). Determine the average product of labour (APL) and marginal product of labour (MPL)
Kelo
yes,thank you
Shukri
Can I ask you other question?
Shukri
what is monopoly mean?
Habtamu Reply
What is different between quantity demand and demand?
Shukri Reply
Quantity demanded refers to the specific amount of a good or service that consumers are willing and able to purchase at a give price and within a specific time period. Demand, on the other hand, is a broader concept that encompasses the entire relationship between price and quantity demanded
Ezea
ok
Shukri
how do you save a country economic situation when it's falling apart
Lilia Reply
what is the difference between economic growth and development
Fiker Reply
Economic growth as an increase in the production and consumption of goods and services within an economy.but Economic development as a broader concept that encompasses not only economic growth but also social & human well being.
Shukri
production function means
Jabir
What do you think is more important to focus on when considering inequality ?
Abdisa Reply
any question about economics?
Awais Reply
sir...I just want to ask one question... Define the term contract curve? if you are free please help me to find this answer 🙏
Asui
it is a curve that we get after connecting the pareto optimal combinations of two consumers after their mutually beneficial trade offs
Awais
thank you so much 👍 sir
Asui
In economics, the contract curve refers to the set of points in an Edgeworth box diagram where both parties involved in a trade cannot be made better off without making one of them worse off. It represents the Pareto efficient allocations of goods between two individuals or entities, where neither p
Cornelius
In economics, the contract curve refers to the set of points in an Edgeworth box diagram where both parties involved in a trade cannot be made better off without making one of them worse off. It represents the Pareto efficient allocations of goods between two individuals or entities,
Cornelius
Suppose a consumer consuming two commodities X and Y has The following utility function u=X0.4 Y0.6. If the price of the X and Y are 2 and 3 respectively and income Constraint is birr 50. A,Calculate quantities of x and y which maximize utility. B,Calculate value of Lagrange multiplier. C,Calculate quantities of X and Y consumed with a given price. D,alculate optimum level of output .
Feyisa Reply
Answer
Feyisa
c
Jabir
the market for lemon has 10 potential consumers, each having an individual demand curve p=101-10Qi, where p is price in dollar's per cup and Qi is the number of cups demanded per week by the i th consumer.Find the market demand curve using algebra. Draw an individual demand curve and the market dema
Gsbwnw Reply
suppose the production function is given by ( L, K)=L¼K¾.assuming capital is fixed find APL and MPL. consider the following short run production function:Q=6L²-0.4L³ a) find the value of L that maximizes output b)find the value of L that maximizes marginal product
Abdureman
Got questions? Join the online conversation and get instant answers!
Jobilize.com Reply

Get Jobilize Job Search Mobile App in your pocket Now!

Get it on Google Play Download on the App Store Now


Source:  OpenStax, From matlab and simulink to real-time with ti dsp's. OpenStax CNX. Jun 08, 2009 Download for free at http://cnx.org/content/col10713/1.1
Google Play and the Google Play logo are trademarks of Google Inc.

Notification Switch

Would you like to follow the 'From matlab and simulink to real-time with ti dsp's' conversation and receive update notifications?

Ask