

| << Chapter < Page | Chapter >> Page > |
More important, however, is to note what has happened to the top two sinusoids. Because the frequencies of the top two sinusoids are above thefolding frequency, they no longer have a minimum of two samples per cycle. Thus, the apparent frequency of these two sinusoids has folded around the foldingfrequency and appears as a lower frequency.
In fact, the plot of the top sinusoid now looks exactly like the plot of the bottom sinusoid at a frequency of 0.25 cycles per second. This means that theenergy in the top sinusoid at 1.75 cycles per second has folded into a new frequency of 0.25 cycles per second.
The plot of the sinusoid immediately above the center looks exactly like the plot of the sinusoid immediately below the center at a frequency of 0.50 cyclesper second. This means that the energy in that sinusoid at 1.5 cycles per second has folded into a new frequency of 0.5 cycles per second.
The plots of the center sinusoid and the two sinusoids below the center are still correct (although not very well sampled). However, the frequency information embodied in the top two sinusoids has been lost. The top twosinusoids appear to be at a different frequency than the actual frequency of the corresponding analog signals. The fact that the frequencies of these twosinusoids were originally 1.75 and 1.50 cycles per second is now lost in the sampled data.
Now I'm going to illustrate the same folding phenomena from a different perspective using spectral analyses. First I will show you a case having nosampling problems. Then I will introduce a sampling problem and show you the impact that the problem has on the final results.
Figure 7 shows the result of performing spectral analyses on five different sinusoids (not the same five as in the previous discussion). Each plot in Figure 7 shows the spectrum of a different sinusoid. The spectrum is computed and displayed from zero frequency on the left to the folding frequency on theright.
| Figure 7. Spectral analyses of five sinusoids with no sampling problems. |
|---|
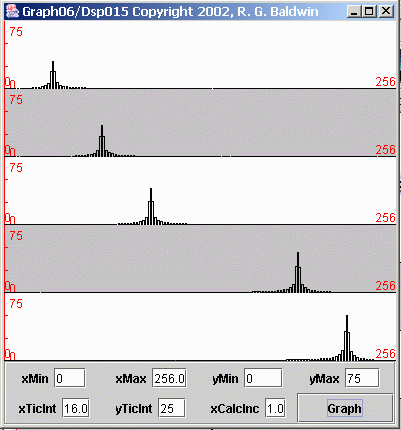 |
The sampling frequency for the data in Figure 7 was four samples per second, giving a folding frequency of two cycles per second. Thus, the horizontal scaleon each plot represents the frequencies from zero on the left to two cycles per second on the right.
Starting at the top, each of the five plots represents the frequency spectrum of a sinusoid having the amplitude and frequency shown in the following table.
Plot  Amplitude  Frequency
1     60         0.25 cycles per second2     70         0.50 cycles per second
3     80         0.75 cycles per second4     90         1.50 cycles per second
5     100        1.75 cycles per second
The height of each spectral peak in Figure 7 is consistent with the amplitude of the corresponding sinusoid given in the table.
Notification Switch
Would you like to follow the 'Digital signal processing - dsp' conversation and receive update notifications?

|
|

|
|

|
|

|
|
|
|
|

|
|

|
|

|
|

|
|

|