

| << Chapter < Page | Chapter >> Page > |
As before, the lengths of the individual time series will be 80, 160, 240, 320, and 400 samples respectively.
I will perform a Fourier transform on each of the time series in an attempt to show that the spectrum of each time series consists of two peaks, (two spectral lines) , with one peak corresponding to each of the sinusoids added together to create the time series. The five spectra are shown in Figure 12 .
| Figure 12. Spectra of five different time series of different lengths. |
|---|
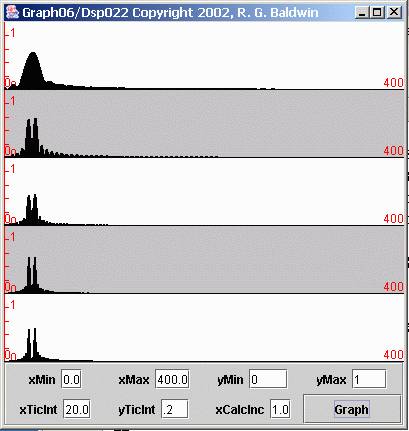 |
Once again, let's begin with the plot at the bottom of Figure 12 . As you can see, this spectrum shows two very distinct spectral peaks. Thus, for this amountof frequency separation and a length of 400 samples, the Fourier transform did a good job of separating the two peaks.
Moving upward in Figure 12 , we see that the Fourier transform on the time series with a length of 320 samples (the fourth plot from the top) also did a good job of separating the two peaks.
However, with respect to separation the process began to deteriorate for lengths of 240 samples and 160 samples.
For a length of 80 samples, the two peaks merged completely.
Figure 13 shows a horizontally-expanded view of the same spectral data to give you a better idea of the structure of the peaks. The plots in Figure 13 show only the first fifty frequency values.
| Figure 13. Spectra of five different time series of different lengths |
|---|
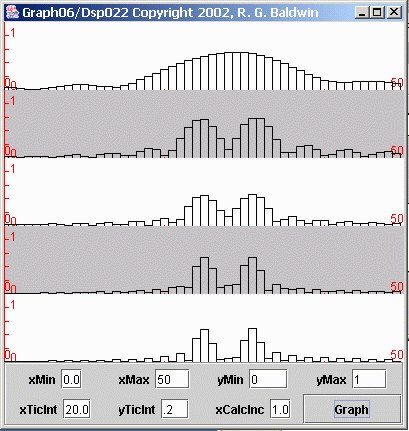 |
You may find it interesting to make a side-by-side comparison of Figures 13 and 11 in separate browser windows.
Before leaving this topic, there are a few more things that I want to show you. If you go back and look at the bottom plot in Figure 11 , you will note an interesting characteristic of that plot. In particular, starting at the peak andmoving outward in both directions, every second plotted value is zero. I'm going to explain the reason for and the significance of this characteristic.
(As I mentioned earlier, there are also zero-valued points in the spectra of the time series with the shorter averaging windows. Once youunderstand the reason for the zero-valued points, you can correlate the positions of those points to the length of the averaging window.)
To begin with, the Fourier transform program that was used to compute this spectrum computed 400 values at equally spaced points between zero and thefolding frequency (only the first 50 values are shown in Figure 11 ). Thus, each of the side-by-side rectangles in Figure 11 represents the spectral value computed at one of the 400 frequency points.
The sinusoid that was used as the target for this spectral analysis had 32 samples per cycle. Since this sinusoid was generated mathematically instead ofbeing the result of sampling an analog signal, we can consider the sampling frequency to be anything that we want.
Notification Switch
Would you like to follow the 'Digital signal processing - dsp' conversation and receive update notifications?

|
|

|
|

|
|

|
|

|
|

|
|

|
|
|
|
|

|
|

|