| << Chapter < Page | Chapter >> Page > |
As you can see in these figures, regardless of which graphical treatment you use, the sampling frequency relative to the signal frequency is sufficientlyhigh to present a respectable view of the sinusoidal signals. Now I'm going to show you what happens when the sampling frequency is reduced without changingthe frequency of the sinusoids.
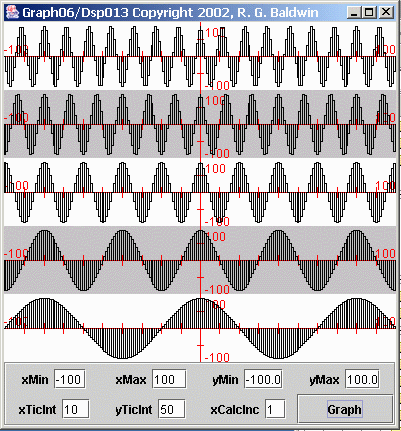
Figure 5 shows the same five sinusoids as above, except that they are plotted across a longer period of time. (The presentation in Figure 5 treats each sample as a rectangle.)
| Figure 5. Five sampled sinusoids |
|---|
 |
In particular, you should note the obvious frequency difference between the top sinusoid and the bottom sinusoid. Also note the frequency difference betweenthe two sinusoids immediately above and immediately below the center sinusoid.
Let's put some numbers to the frequencies involved. If we consider the sampling frequency to be 20 samples per second, then the center sinusoid has afrequency of one cycle per second, with 20 samples per cycle. On that basis, the frequencies of the sinusoids from top to bottom are as shown below:
1.75 cycles per second
1.50 cycles per second1.00 cycles per second
0.50 cycles per second0.25 cycles per second
The most important thing to note about these frequency values is how the four outer frequencies relate to the center frequency. The top and bottom frequencyvalues differ from the center frequency by 0.75 cycles per second. In other words, the frequency of the top sinusoid is 0.75 cycles per second above thefrequency of the center sinusoid, and the frequency of the bottom sinusoid is 0.75 cycles per second below the frequency of the center sinusoid.
Similarly, the second and fourth frequency values differ from the center frequency by 0.50 cycles per second. Again, one is above and the other is below.
What I am going to do now is to recalculate and re-plot the values for each sinusoid at a sampling frequency of two samples per second instead of 20 samplesper second. This will place the frequency of the center sinusoid exactly at the folding frequency of one cycle per second. More importantly, this will place thefrequencies of the top two sinusoids above the folding frequency.
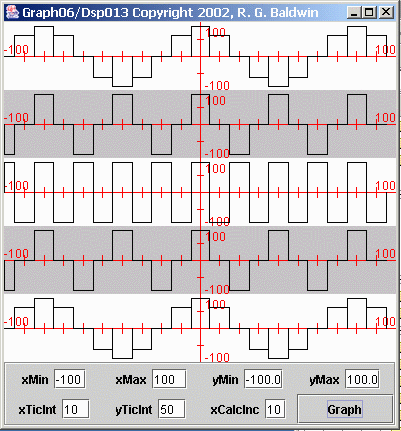
I will re-plot the data for each sinusoid across the same period of time as in Figure 5 . The results are shown in Figure 6 . It would probably be useful for you to view Figure 5 and Figure 6 side-by-side in separate browser windows.
| Figure 6. Result of re-sampling the five sinusoids. |
|---|
 |
There are several important things to note about Figure 6 .
First, you will probably notice that the plot for the center sinusoid no longer looks much like a sinusoid. Rather, it looks like a square wave. This isthe result of having exactly two samples per cycle of the sinusoid. One sample is taken from the positive lobe of the sinusoid, and the next sample is takenfrom the negative lobe of the sinusoid. This pattern repeats, producing something that looks like a square wave. (A different graphical treatment would make it look like a triangular wave.)

Notification Switch
Would you like to follow the 'Digital signal processing - dsp' conversation and receive update notifications?