

| << Chapter < Page | Chapter >> Page > |
A sample of the output produced by the FFT applet is shown in Figure 1 .
| Figure 1. Transform of pulse with negative slope. |
|---|
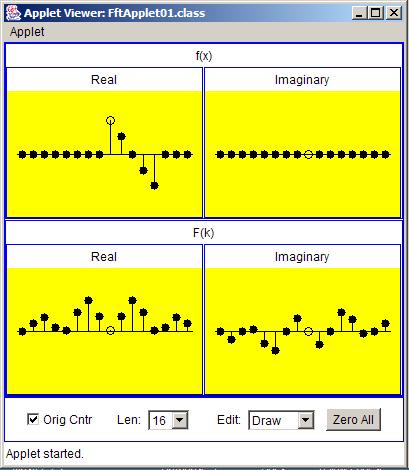 |
An examination of Figure 1 shows that the display produced by the applet contains two sections. One section is labeled f(x) and the other section islabeled F(k).
This is an interactive applet with the ability to transform the complex samples represented by f(x) into complex samples represented by F(k).Alternatively, the applet can be used to transform complex samples represented by F(k) into complex samples represented by f(x).
Each section contains two boxes, one labeled Real and the other labeled Imaginary. One box contains a visual representation of a set of real samplesand the other box contains a visual representation of a set of imaginary samples.
With one exception, each sample is represented by a black circle. In each box, one of the samples is represented by an empty circle. The empty circle represents an index value of zero. Samples to the right of the sample withthe empty circle are samples at positive indices, and samples to the left of the sample with the empty circle are samples at negative indices.
A pair of values, one taken from the Real box and one taken from the Imaginary box, represents a complex sample.
Any of the circles can be interactively moved up or down with the mouse. The value of each sample is represented by the distance of the correspondingcircle from the horizontal line.
When a change is made to the value of any sample belonging to either f(x) for F(k), the transformation is recomputed and the display of the otherfunction is modified accordingly. If you modify the value of a sample in f(x), the values in F(k) are automatically modified to show the Fouriertransform of f(x). If you modify the value of a sample in F(k), the values in f(x) are automatically modified to show the inverse Fourier transform ofF(k).
This is an extremely powerful interactive tool.
Many and perhaps most FFT algorithms require the input series to contain a number of complex samples that is a power of two such as 2, 4, 8, 16, 32,etc. Most FFT algorithms also produce the same number of complex samples in the output as are provided in the input. The FFT algorithm used in thisapplet is no exception to those rules.
A pull-down list at the bottom of the applet lets the user specify 16, 32, or 64 complex samples for both the input and the output. All of theexamples in this module use 16 complex samples for input and output.
The applet also provides a check box that allows the user to cause the origin (the empty circle at index value zero) to either be centered or placed at the left end. The display in Figure 1 has the origin centered. Other displays that I will use later have the origin at the left end.
The other pull-down list and the button at the bottom of the applet provide other control features that don't need to be discussed here. Istrongly urge you to download this applet and experiment with it. The results can be very enlightening.
Notification Switch
Would you like to follow the 'Digital signal processing - dsp' conversation and receive update notifications?

|
|

|
|

|
|

|
|

|
|

|
|

|
|

|
|

|
|

|