

| << Chapter < Page | Chapter >> Page > |
In the equation, , is a constant and has different effects on the graph of the function. The general shape of the graph of functions of this form is shown in [link] for the function .

On the same set of axes, plot the following graphs:
Use your results to deduce the effect of .
You should have found that, once again, the value of affects the periodicity (i.e. frequency) of the graph. As increases, the graph is more tightly packed. As decreases, the graph is more spread out. The period of the tan graph is given by .
These different properties are summarised in [link] .
 |
 |
For , the domain of one branch is because the function is undefined for and .
The range of is .
For functions of the form, , the details of calculating the intercepts with the and axis are given.
There are many -intercepts; each one is halfway between the asymptotes.
The -intercept is calculated as follows:
The graph of has asymptotes because as approaches , approaches infinity. In other words, there is no defined value of the function at the asymptote values.
In the equation, , is a constant and has different effects on the graph of the function. The general shape of the graph of functions of this form is shown in [link] for the function .

On the same set of axes, plot the following graphs:
Use your results to deduce the effect of .
You should have found that the value of affects the position of the graph along the -axis (i.e. the -intercept) and the position of the graph along the -axis (i.e. the phase shift ). The value shifts the graph horizontally. If is positive, the graph shifts left and if is negative tha graph shifts right.
These different properties are summarised in [link] .
 |
 |
For , the domain is because there is no value of for which is undefined.
The range of is .
For functions of the form, , the details of calculating the intercept with the axis are given.
The -intercept is calculated as follows: set
In the equation, , is a constant and has different effects on the graph of the function. The general shape of the graph of functions of this form is shown in [link] for the function .
On the same set of axes, plot the following graphs:
Use your results to deduce the effect of .
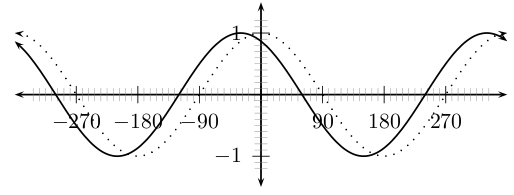
You should have found that the value of affects the -intercept and phase shift of the graph. As in the case of the sine graph, positive values of shift the cosine graph left while negative values shift the graph right.
These different properties are summarised in [link] .
 |
 |
For , the domain is because there is no value of for which is undefined.
The range of is .
For functions of the form, , the details of calculating the intercept with the axis are given.
The -intercept is calculated as follows: set
In the equation, , is a constant and has different effects on the graph of the function. The general shape of the graph of functions of this form is shown in [link] for the function .

On the same set of axes, plot the following graphs:
Use your results to deduce the effect of .
You should have found that the value of once again affects the -intercept and phase shift of the graph. There is a horizontal shift to the left if is positive and to the right if is negative.
These different properties are summarised in [link] .
 |
 |
For , the domain for one branch is because the function is undefined for and .
The range of is .
For functions of the form, , the details of calculating the intercepts with the axis are given.
The -intercept is calculated as follows: set
The graph of has asymptotes because as approaches , approaches infinity. Thus, there is no defined value of the function at the asymptote values.
Using your knowledge of the effects of and draw a rough sketch of the following graphs without a table of values.
Notification Switch
Would you like to follow the 'Siyavula textbooks: grade 11 maths' conversation and receive update notifications?

|
|

|
|

|
|

|
|

|
|

|
|

|
|

|
|

|
|

|