<< Chapter < Page Chapter >> Page >

Uitkomste

Die uitkoms van ’n eksperiment is ’n enkele resultaat van daardie eksperiment.

  • ’n Moontlike uitkoms van Eksperiment 1: die waarde van die boonste vlak is ‘3’
  • ’n Moontlike uitkoms van Eksperiment 2: die totale waarde van die boonste vlakke is ‘9’

Steekproefruimte

Die steekproefruimte van ’n eksperiment is die volledige stel moontlike uitkomste van die eksperiment.

  • Eksperiment 1: die steekproefruimte is 1,2,3,4,5,6
  • Eksperiment 2: die steekproefruimte is 2,3,4,5,6,7,8,9,10,11,12

Interessante feit

Wanneer jy twee dobbelstene werp en die resultate sommeer, is die mees algemene uitkoms sewe. Om dit te verstaan, onthou dat daar net een manier bestaan waarop twee as ’n resultaat verkry kan word (beide stene land op een) en daar is slegs een manier om 12 as ’n resultaat te kry (beide stene land op ses). Die teenoorgestelde kante van ’n ses-kantige dobbelsteen sommeer na sewe. Van hierdie inligting moet jy kan uitredeneer dat daar 12 maniere bestaan waarop sewe verkry kan word.

Gebeurtenisse

’n Gebeurtenis is enige stel uitkomste van ’n eksperiment

  • ’n Moontlike gebeurtenis van Eksperiment 1: ’n ewe-nommer op die boonste vlak van die dobbelsteen
  • ’n Moontlike gebeurtenis van Eksperiment 2: die getalle op die boonste vlakke is gelyk

Ewekansige eksperimente

Die begrip ewekansige eksperiment of statistiese eksperiment word gebruik om enige herhaalbare proses te beskryf waarvan die resultate op een of ander manier ontleed is. Byvoorbeeld, die opskiet van ’n muntstuk en aantekening van die resultaat is ’n ewekansige eksperiment, want die proses is herhaalbaar. Aan die ander kant, jou lees van hierdie sin vir die eerste keer en aantekening van of jy dit verstaan of nie is nie ’n ewekansige eksperiment nie, omdat dit nie herhaalbaar is nie (indien jy wel ’n reeks verskeie mense vra om dit te lees en ’n aantekening te maak oor of hulle dit verstaan, al dan nie, sal dit ’n ewekansige eksperiment word).

Venn diagramme

’n Venn-diagram kan gebruik word om die verhouding tussen die moontlike uitkomste van ’n ewekansige eksperiment en die steekproefruimte te toon. Die Venn-diagram op [link] toon die verskil tussen die universele stel, ’n voorbeeldruimte en gebeure en hul uitkomste as deelversamelings van die steekproefruimte.

Diagram om die verskil tussen die universele stel en voorbeeldruimte uit te beeld. Die voorbeeldruimte bestaan uit alle moontlike uitkomste van ’n statistiese eksperiment en ’n gebeurtenis is 'n deelruimte van die voorbeeld ruimte.

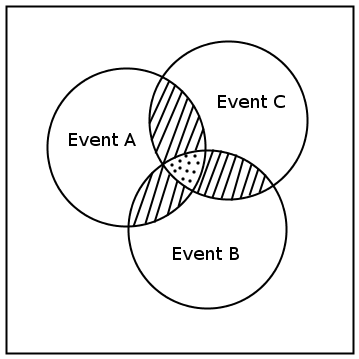
Ons kan Venn-diagramme teken vir eksperimente met twee en drie gebeurtenisse. Hulle word gewys in [link] en [link] . Venn-diagramme vir eksperimente met meer as drie gebeurtenisse is meer kompleks en word nie op hierdie vlak behandel nie.
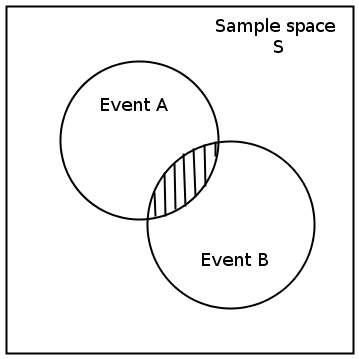
Venn-diagram vir ’n eksperiment met twee gebeurtenisse.
Venn-diagram vir ’n eksperiment met drie gebeurtenisse.

Interessante feit

Die Grieks-, Russiese- en Latynse-alfabet kan geïllustreer word deur middel van Venn-diagramme. Al drie hierdie alfabette het sommige gemene letters. Die Venn-diagram word hier onder gegee:

Die vereniging van A en B is die stel van alle elemente in A of in B (of in beide). A of B word ook geskryf as A B . Die snypunt van A en B is die stel van alle elemente in beide A én B . A en B word ook geskryf as A B .

Questions & Answers

differentiate between demand and supply giving examples
Lambiv Reply
differentiated between demand and supply using examples
Lambiv
what is labour ?
Lambiv
how will I do?
Venny Reply
how is the graph works?I don't fully understand
Rezat Reply
information
Eliyee
devaluation
Eliyee
t
WARKISA
hi guys good evening to all
Lambiv
multiple choice question
Aster Reply
appreciation
Eliyee
explain perfect market
Lindiwe Reply
In economics, a perfect market refers to a theoretical construct where all participants have perfect information, goods are homogenous, there are no barriers to entry or exit, and prices are determined solely by supply and demand. It's an idealized model used for analysis,
Ezea
What is ceteris paribus?
Shukri Reply
other things being equal
AI-Robot
When MP₁ becomes negative, TP start to decline. Extuples Suppose that the short-run production function of certain cut-flower firm is given by: Q=4KL-0.6K2 - 0.112 • Where is quantity of cut flower produced, I is labour input and K is fixed capital input (K-5). Determine the average product of lab
Kelo
Extuples Suppose that the short-run production function of certain cut-flower firm is given by: Q=4KL-0.6K2 - 0.112 • Where is quantity of cut flower produced, I is labour input and K is fixed capital input (K-5). Determine the average product of labour (APL) and marginal product of labour (MPL)
Kelo
yes,thank you
Shukri
Can I ask you other question?
Shukri
what is monopoly mean?
Habtamu Reply
What is different between quantity demand and demand?
Shukri Reply
Quantity demanded refers to the specific amount of a good or service that consumers are willing and able to purchase at a give price and within a specific time period. Demand, on the other hand, is a broader concept that encompasses the entire relationship between price and quantity demanded
Ezea
ok
Shukri
how do you save a country economic situation when it's falling apart
Lilia Reply
what is the difference between economic growth and development
Fiker Reply
Economic growth as an increase in the production and consumption of goods and services within an economy.but Economic development as a broader concept that encompasses not only economic growth but also social & human well being.
Shukri
production function means
Jabir
What do you think is more important to focus on when considering inequality ?
Abdisa Reply
any question about economics?
Awais Reply
sir...I just want to ask one question... Define the term contract curve? if you are free please help me to find this answer 🙏
Asui
it is a curve that we get after connecting the pareto optimal combinations of two consumers after their mutually beneficial trade offs
Awais
thank you so much 👍 sir
Asui
In economics, the contract curve refers to the set of points in an Edgeworth box diagram where both parties involved in a trade cannot be made better off without making one of them worse off. It represents the Pareto efficient allocations of goods between two individuals or entities, where neither p
Cornelius
In economics, the contract curve refers to the set of points in an Edgeworth box diagram where both parties involved in a trade cannot be made better off without making one of them worse off. It represents the Pareto efficient allocations of goods between two individuals or entities,
Cornelius
Suppose a consumer consuming two commodities X and Y has The following utility function u=X0.4 Y0.6. If the price of the X and Y are 2 and 3 respectively and income Constraint is birr 50. A,Calculate quantities of x and y which maximize utility. B,Calculate value of Lagrange multiplier. C,Calculate quantities of X and Y consumed with a given price. D,alculate optimum level of output .
Feyisa Reply
Answer
Feyisa
c
Jabir
the market for lemon has 10 potential consumers, each having an individual demand curve p=101-10Qi, where p is price in dollar's per cup and Qi is the number of cups demanded per week by the i th consumer.Find the market demand curve using algebra. Draw an individual demand curve and the market dema
Gsbwnw Reply
suppose the production function is given by ( L, K)=L¼K¾.assuming capital is fixed find APL and MPL. consider the following short run production function:Q=6L²-0.4L³ a) find the value of L that maximizes output b)find the value of L that maximizes marginal product
Abdureman
types of unemployment
Yomi Reply
What is the difference between perfect competition and monopolistic competition?
Mohammed
Got questions? Join the online conversation and get instant answers!
Jobilize.com Reply

Get Jobilize Job Search Mobile App in your pocket Now!

Get it on Google Play Download on the App Store Now


Source:  OpenStax, Siyavula textbooks: wiskunde (graad 10) [caps]. OpenStax CNX. Aug 04, 2011 Download for free at http://cnx.org/content/col11328/1.4
Google Play and the Google Play logo are trademarks of Google Inc.

Notification Switch

Would you like to follow the 'Siyavula textbooks: wiskunde (graad 10) [caps]' conversation and receive update notifications?

Ask