<< Chapter < Page Chapter >> Page >

Social sciences

Grade 8

Geography: settlements

Module 2

Comparing land use patterns in various areas

Activity 1:

To interpret information from sources and answer ensuing questions

[lo 2.2]

Study the following illustrations and answer the questions that follow:

1. What type of land use would you say is most prominent in this area?

2. Would you say that there has been a change in die original use of land in this area? Give a reason for your answer.

3. How did the activities impact on the natural resources of the environment?

4. Would you say that this is the ideal situation for urban development and land use?

Activity 2:

To interpret information from sources and answering ensuing questions

[lo 2.2]

Study the following illustration and answer the questions that follow:

1. Is the area depicted in the illustration, densely or sparsely populated? Motivate your answer.

2. Would you classify the area as rural or urban?

3. What type of land use is depicted in the illustration?

4. Would you consider the price of land in this area as cheap or expensive? Motivate your answer.

Activity 3:

To obtain information from environmental sources

[lo 2.2]

Answer the following questions:

1. Find out what percentage of the town/city where you live, or closest to where you live, is set aside for industrial purposes.

2. Find out what percentage (%) of the town/city is set aside for residential purposes.

3. Where would you expect to find the areas where the more wealthy people live? Is it close to the central business district or on the outskirts?

3. Migration of the population due to political policies

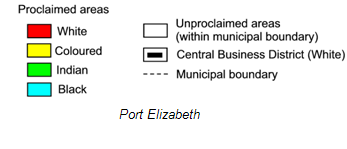
In South Africa we find a unique land use pattern, because of the political decisions of the past. If we look at an urban map of Port Elizabeth, we notice that certain neighbourhoods are inhabited by more than one population group. This is still the result of the policy of segregation and apartheid legislation before 1994. This policy determined that different population groups were to live in separate areas.

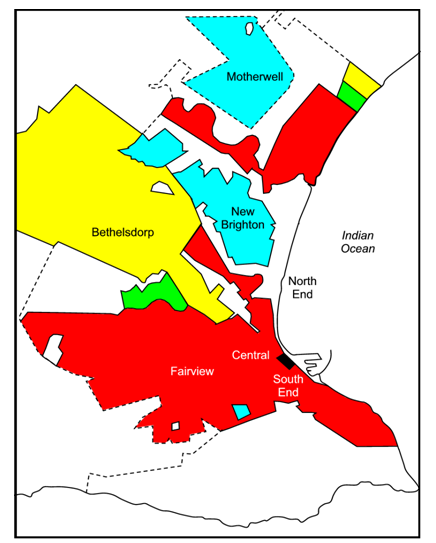
There was a time when Port Elizabeth’s South-End was inhabited by various population groups. However, when the National Party was in power, all residents were relocated to areas such as Malabar en New Brighton. Members of the Indian community were forced to settle in Malabar, and coloured people in New Brighton. This meant that certain people had to leave their homes and start anew. They had no choice as to where they preferred to live. Those belonging to a specific population group were obliged to move to an area allocated to people of their own culture.

Today we still suffer from the effects of this policy. Sometimes people were concentrated in a neighbourhood without a proper infrastructure like roads, electricity and housing. They could not afford to live anywhere else.

Activity 4:

To obtain and interpret information from maps

[lo 1.2]

Study the following illustration and answer the questions that follow

1. What do you know about the sizes of homes in different neighbourhoods?

2. What neighbourhood would be most densely populated?

Questions & Answers

differentiate between demand and supply giving examples
Lambiv Reply
differentiated between demand and supply using examples
Lambiv
what is labour ?
Lambiv
how will I do?
Venny Reply
how is the graph works?I don't fully understand
Rezat Reply
information
Eliyee
devaluation
Eliyee
t
WARKISA
hi guys good evening to all
Lambiv
multiple choice question
Aster Reply
appreciation
Eliyee
explain perfect market
Lindiwe Reply
In economics, a perfect market refers to a theoretical construct where all participants have perfect information, goods are homogenous, there are no barriers to entry or exit, and prices are determined solely by supply and demand. It's an idealized model used for analysis,
Ezea
What is ceteris paribus?
Shukri Reply
other things being equal
AI-Robot
When MP₁ becomes negative, TP start to decline. Extuples Suppose that the short-run production function of certain cut-flower firm is given by: Q=4KL-0.6K2 - 0.112 • Where is quantity of cut flower produced, I is labour input and K is fixed capital input (K-5). Determine the average product of lab
Kelo
Extuples Suppose that the short-run production function of certain cut-flower firm is given by: Q=4KL-0.6K2 - 0.112 • Where is quantity of cut flower produced, I is labour input and K is fixed capital input (K-5). Determine the average product of labour (APL) and marginal product of labour (MPL)
Kelo
yes,thank you
Shukri
Can I ask you other question?
Shukri
what is monopoly mean?
Habtamu Reply
What is different between quantity demand and demand?
Shukri Reply
Quantity demanded refers to the specific amount of a good or service that consumers are willing and able to purchase at a give price and within a specific time period. Demand, on the other hand, is a broader concept that encompasses the entire relationship between price and quantity demanded
Ezea
ok
Shukri
how do you save a country economic situation when it's falling apart
Lilia Reply
what is the difference between economic growth and development
Fiker Reply
Economic growth as an increase in the production and consumption of goods and services within an economy.but Economic development as a broader concept that encompasses not only economic growth but also social & human well being.
Shukri
production function means
Jabir
What do you think is more important to focus on when considering inequality ?
Abdisa Reply
any question about economics?
Awais Reply
sir...I just want to ask one question... Define the term contract curve? if you are free please help me to find this answer 🙏
Asui
it is a curve that we get after connecting the pareto optimal combinations of two consumers after their mutually beneficial trade offs
Awais
thank you so much 👍 sir
Asui
In economics, the contract curve refers to the set of points in an Edgeworth box diagram where both parties involved in a trade cannot be made better off without making one of them worse off. It represents the Pareto efficient allocations of goods between two individuals or entities, where neither p
Cornelius
In economics, the contract curve refers to the set of points in an Edgeworth box diagram where both parties involved in a trade cannot be made better off without making one of them worse off. It represents the Pareto efficient allocations of goods between two individuals or entities,
Cornelius
Suppose a consumer consuming two commodities X and Y has The following utility function u=X0.4 Y0.6. If the price of the X and Y are 2 and 3 respectively and income Constraint is birr 50. A,Calculate quantities of x and y which maximize utility. B,Calculate value of Lagrange multiplier. C,Calculate quantities of X and Y consumed with a given price. D,alculate optimum level of output .
Feyisa Reply
Answer
Feyisa
c
Jabir
the market for lemon has 10 potential consumers, each having an individual demand curve p=101-10Qi, where p is price in dollar's per cup and Qi is the number of cups demanded per week by the i th consumer.Find the market demand curve using algebra. Draw an individual demand curve and the market dema
Gsbwnw Reply
suppose the production function is given by ( L, K)=L¼K¾.assuming capital is fixed find APL and MPL. consider the following short run production function:Q=6L²-0.4L³ a) find the value of L that maximizes output b)find the value of L that maximizes marginal product
Abdureman
types of unemployment
Yomi Reply
What is the difference between perfect competition and monopolistic competition?
Mohammed
Got questions? Join the online conversation and get instant answers!
Jobilize.com Reply

Get Jobilize Job Search Mobile App in your pocket Now!

Get it on Google Play Download on the App Store Now


Source:  OpenStax, Geography grade 8. OpenStax CNX. Sep 11, 2009 Download for free at http://cnx.org/content/col11036/1.1
Google Play and the Google Play logo are trademarks of Google Inc.

Notification Switch

Would you like to follow the 'Geography grade 8' conversation and receive update notifications?

Ask