<< Chapter < Page Chapter >> Page >

Chebyshev filter properties

The Butterworth filter does not give a sufficiently good approximation across the complete passband in many cases. TheTaylor's series approximation is often not suited to the way specifications are given for filters. An alternate error measure isthe maximum of the absolute value of the difference between the actual filter response and the ideal. This is considered over thetotal passband. This is the Chebyshev error measure and was defined and applied to the FIR filter design problem. For the IIR filter,the Chebyshev error is minimized over the passband and a Taylor's series approximation at ω = is used to determine the stopband performance. This mixture of methods in the IIR case iscalled the Chebyshev filter, and simple design formulas result, just as for the Butterworth filter.

The design of Chebyshev filters is particularly interesting, because the results of a very elegant theory insure thatconstructing a frequency-response function with the proper form of equal ripple in the error will result in a minimum Chebyshev errorwithout explicitly minimizing anything. This allows a straightforward set of design formulas to be derived which can beviewed as a generalization of the Butterworth formulas [link] , [link] .

The form for the magnitude squared of the frequency-response function for the Chebyshev filter is

| F ( j ω ) | 2 = 1 1 + ϵ 2 C N ( ω ) 2

where C N ( ω ) is an Nth-order Chebyshev polynomial and ϵ is a parameter that controls the ripple size. This polynomial in ω has very special characteristics that result in the optimality of the response function [link] .

Chebyshev polynomials

The Chebyshev polynomial is a powerful function in approximation theory. Although the function is a polynomial, it isbest defined and developed in terms of trigonometric functions by [link] , [link] , [link] , [link] .

C N ( ω ) = cos ( N cos - 1 ( ω ) )

where C N ( ω ) is an Nth-order, real-valued function of the real variable ω . The development is made clearer by introducing an intermediate complex variable φ .

C N ( ω ) = cos ( N φ )

where

ω = cos ( φ )

Although this definition of C N ( ω ) may not at first appear to result in a polynomial, the following recursive relation derivedfrom [link] shows that it is a polynomial.

C N + 1 ( ω ) = 2 ω C N ( ω ) - C N - 1 ( ω )

From [link] , it is clear that C 0 = 1 and C 1 = ω , and from [link] , it follows that

C 2 = 2 ω 2 - 1
C 3 = 4 ω 3 - 3 ω
C 4 = 8 ω 4 - 8 ω 2 + 1

etc.

Other relations useful for developing these polynomials are

C N 2 ( ω ) = ( C 2 N ( ω ) + 1 ) / 2
C M N ( ω ) = C M ( C N ( ω ) )

where M and N are coprime.

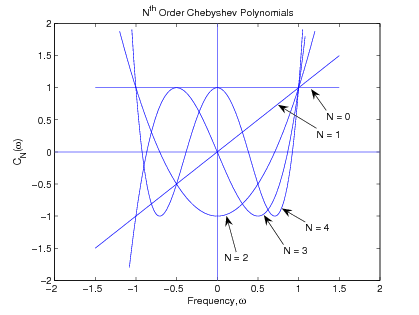
These are remarkable functions [link] . They oscillate between +1 and -1 for - 1 < ω < 1 and go monotonically to +/- infinity outside that domain. All N of their zeros are real and fall in the domain of - 1 < ω < 1 , i.e., C N is an equal ripple approximation to zero over the range of ω from -1 to +1. In addition, the values for ω where C N reaches its local maxima and minima and is zero are easily calculated from [link] and [link] . For - 1 < ω < 1 , a plot of C N ( ω ) can be made using the concept of Lissajous figures. Example plots for C 0 , C 1 , C 2 , C 3 , and C 4 are shown in [link] .

Figure one is a graph titled Nth order chebyshev polynomials. Its horizontal axis is labeled Frequency, ω, and ranges in value from -2 to 2 in increments of 0.5. The vertical axis is labeled C_N(ω) and ranges in value from -2 to 2 in increments of 0.5. There are four curves in this figure. The first is a diagonal line with constant positive slope that passes through the origin. The second is parabolic in shape with  its vertex as a minimum of the curve at (0, -1). The third starts from the bottom-left of the graph, increases to a peak at (-0.5, 1) and then decreases to a trough at (0.5, -1), where it finally increases to the top-right area of the graph. The fourth begins in the top-left as a decreasing function, and proceeds to make a trough, a peak, and a trough at (-0.5, -1), (0, 1) and (0.5, -1) respectively. The curve then increases and ends in the top-right area.
Chebyshev Polynomials for N = 0, 1, 2, 3, and 4

The filter frequency-response function for N = 5 is given in [link] showing the passband ripple in terms of the parameter ϵ .

Questions & Answers

what is biology
Hajah Reply
the study of living organisms and their interactions with one another and their environments
AI-Robot
what is biology
Victoria Reply
HOW CAN MAN ORGAN FUNCTION
Alfred Reply
the diagram of the digestive system
Assiatu Reply
allimentary cannel
Ogenrwot
How does twins formed
William Reply
They formed in two ways first when one sperm and one egg are splited by mitosis or two sperm and two eggs join together
Oluwatobi
what is genetics
Josephine Reply
Genetics is the study of heredity
Misack
how does twins formed?
Misack
What is manual
Hassan Reply
discuss biological phenomenon and provide pieces of evidence to show that it was responsible for the formation of eukaryotic organelles
Joseph Reply
what is biology
Yousuf Reply
the study of living organisms and their interactions with one another and their environment.
Wine
discuss the biological phenomenon and provide pieces of evidence to show that it was responsible for the formation of eukaryotic organelles in an essay form
Joseph Reply
what is the blood cells
Shaker Reply
list any five characteristics of the blood cells
Shaker
lack electricity and its more savely than electronic microscope because its naturally by using of light
Abdullahi Reply
advantage of electronic microscope is easily and clearly while disadvantage is dangerous because its electronic. advantage of light microscope is savely and naturally by sun while disadvantage is not easily,means its not sharp and not clear
Abdullahi
cell theory state that every organisms composed of one or more cell,cell is the basic unit of life
Abdullahi
is like gone fail us
DENG
cells is the basic structure and functions of all living things
Ramadan
What is classification
ISCONT Reply
is organisms that are similar into groups called tara
Yamosa
in what situation (s) would be the use of a scanning electron microscope be ideal and why?
Kenna Reply
A scanning electron microscope (SEM) is ideal for situations requiring high-resolution imaging of surfaces. It is commonly used in materials science, biology, and geology to examine the topography and composition of samples at a nanoscale level. SEM is particularly useful for studying fine details,
Hilary
cell is the building block of life.
Condoleezza Reply
Got questions? Join the online conversation and get instant answers!
Jobilize.com Reply

Get Jobilize Job Search Mobile App in your pocket Now!

Get it on Google Play Download on the App Store Now


Source:  OpenStax, Digital signal processing and digital filter design (draft). OpenStax CNX. Nov 17, 2012 Download for free at http://cnx.org/content/col10598/1.6
Google Play and the Google Play logo are trademarks of Google Inc.

Notification Switch

Would you like to follow the 'Digital signal processing and digital filter design (draft)' conversation and receive update notifications?

Ask