<< Chapter < Page Chapter >> Page >
This module builds the tools necessary for the frequency analysis of brain waves as recording by an electroencephalograph. We proceed from the Pythagorean Theorem to sine waves, the trapezoid rule and finally to Fourier decomposition.

Table of contents

0. Background

1. Sine and Cosine Waves

2. Trapezoid Rule for estimating area

3. Fourier Method for decomposing signals

4. Spectrogram application to analyzing brain waves

Background: brain waves and the eeg

Signals are sent through the brain using both chemical and electrical means. The synchronized electrical activity of individual neurons adds up to something big enough to detect on from outside the head. To measure it, we use a set of electrical nodes called an electroencephalogam (EEG). The measured activity reflects different states of the brain which in turn tell us something about the mindset of the person. Our goal in this module is to decompose an EEG signal into its different frequencies, which is intuitively the most meaningful piece of information.

Sine and cosine waves

Brainwaves have complex shapes that are not easily interpreted. In order to study these waves, we need to develop some mathematical tools that will tell us about different waves. To outline, we begin by talking about pure (sine or cosine) waves, then move to the trapezoid rule for estimating area under a curve. Next, we develop Fourier analysis for picking out the frequencies in a jumbled signal, and finally use these tools to create spectrograms, which allow us to track different frequencies over time.

Sine waves

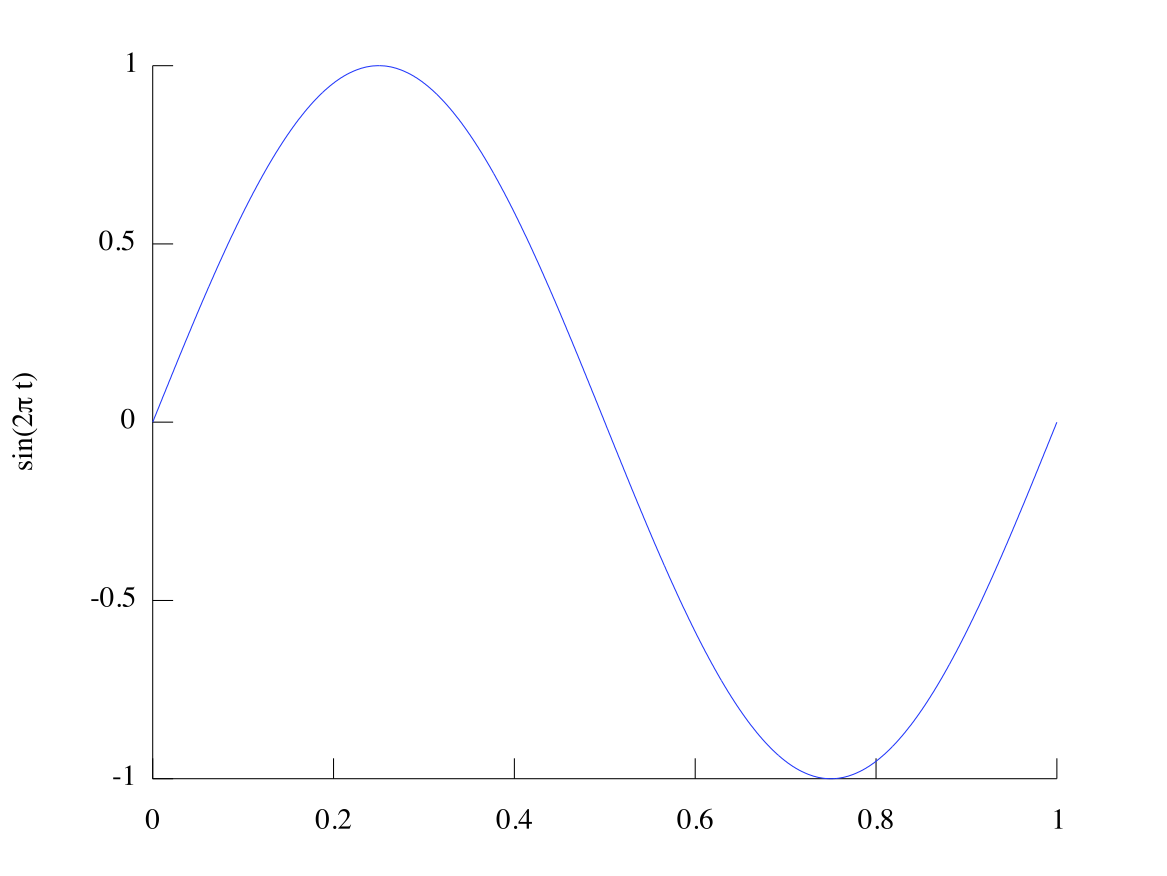
The sine wave is a mathematical function. It describes many physical phenomena, including sound waves and oscillation. It looks just like a wave. MATLAB uses the sin function to make sin waves. For example, to make Figure 1, we use the code:

>>t = 0:.01:1;>>y = sin(2*pi*t);>>plot(t,y);

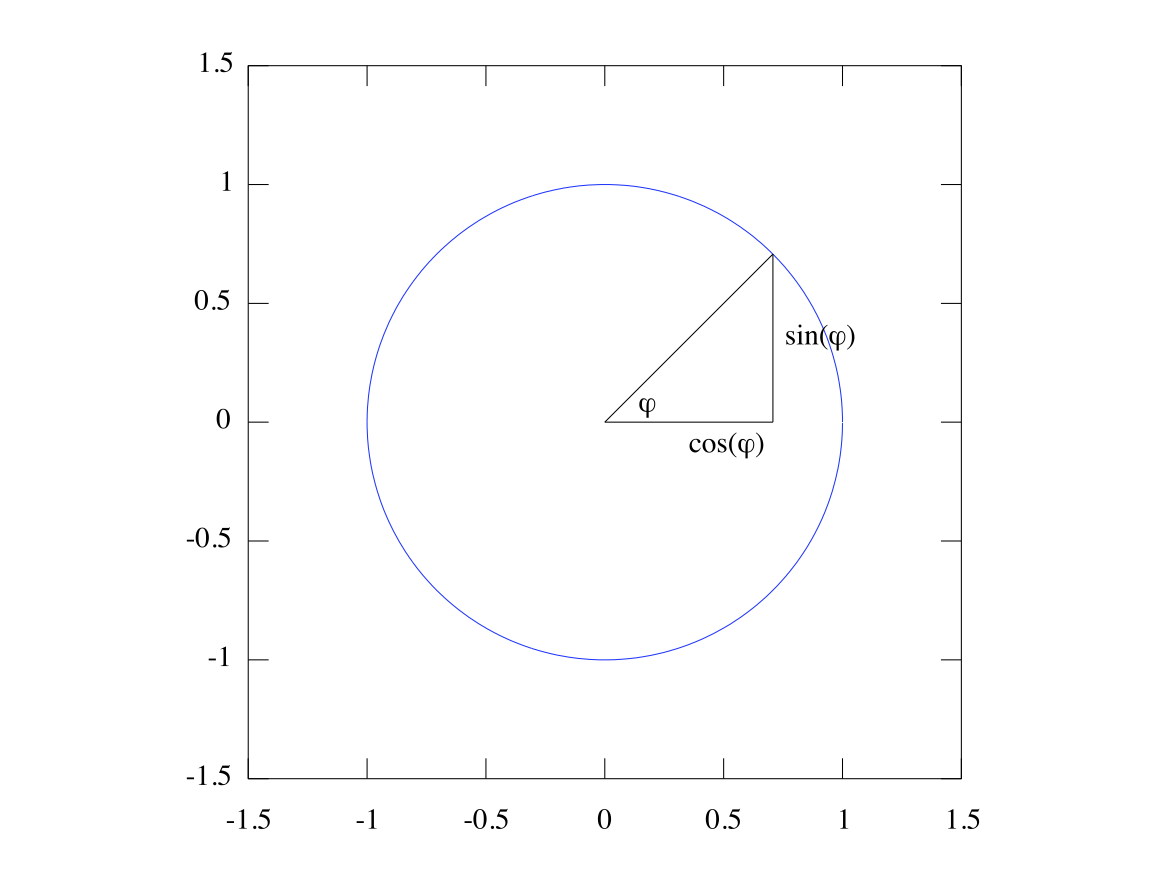
The sine wave is defined by the lengths and angles of a triangle. Run sincirc.m (copied below) to see how the sine and cosine values relate to the angle ϕ of the triangle. As you can see, if ϕ is the angle of a right triangle with hypotenuse 1 (illustrated by the circle) , sin ( ϕ ) is the height of the triangle and cos ( ϕ ) is the base of it:

A sin wave

An envelope with a blue page

The relation of sine and cosine to a triangle and unit circle

An envelope with a white page
Two illustrations of the sine function.
% sincirc.m %% sincirc.m illustrates the relation of the sin and cosine waves to the circle. %define parametersNturns = 2; steps_per_turn = 9;step_inc = 2*pi/steps_per_turn; %set up points for circlecirc_x = cos(0:.01:2*pi); circ_y = sin(0:.01:2*pi);axis equal %loop over triangles with different anglesfor n = 1:Nturns * steps_per_turn; phi = n * step_inc + pi/4;%plot circle, then triangle, then text plot(circ_x, circ_y);axis([-1 1 -1 1] * 1.5);line([0 cos(phi)], [0 sin(phi)]); line([1 1]* cos(phi), [0 sin(phi)]);line([0 cos(phi)], [0 0]); text(cos(phi)/2 , -.1*sign(sin(phi)),'cos(\varphi)')text(cos(phi) + .1*(sign(cos(phi))-.5), sin(phi)/2, 'sin(\varphi)') text(cos(phi)*.2, sin(phi)*.1,'\varphi');pause(.5); end

Characteristics of the sine wave

The sin wave has three primary characteristics:

Questions & Answers

What are the factors that affect demand for a commodity
Florence Reply
differentiate between demand and supply giving examples
Lambiv Reply
differentiated between demand and supply using examples
Lambiv
what is labour ?
Lambiv
how will I do?
Venny Reply
how is the graph works?I don't fully understand
Rezat Reply
information
Eliyee
devaluation
Eliyee
t
WARKISA
hi guys good evening to all
Lambiv
multiple choice question
Aster Reply
appreciation
Eliyee
explain perfect market
Lindiwe Reply
In economics, a perfect market refers to a theoretical construct where all participants have perfect information, goods are homogenous, there are no barriers to entry or exit, and prices are determined solely by supply and demand. It's an idealized model used for analysis,
Ezea
What is ceteris paribus?
Shukri Reply
other things being equal
AI-Robot
When MP₁ becomes negative, TP start to decline. Extuples Suppose that the short-run production function of certain cut-flower firm is given by: Q=4KL-0.6K2 - 0.112 • Where is quantity of cut flower produced, I is labour input and K is fixed capital input (K-5). Determine the average product of lab
Kelo
Extuples Suppose that the short-run production function of certain cut-flower firm is given by: Q=4KL-0.6K2 - 0.112 • Where is quantity of cut flower produced, I is labour input and K is fixed capital input (K-5). Determine the average product of labour (APL) and marginal product of labour (MPL)
Kelo
yes,thank you
Shukri
Can I ask you other question?
Shukri
what is monopoly mean?
Habtamu Reply
What is different between quantity demand and demand?
Shukri Reply
Quantity demanded refers to the specific amount of a good or service that consumers are willing and able to purchase at a give price and within a specific time period. Demand, on the other hand, is a broader concept that encompasses the entire relationship between price and quantity demanded
Ezea
ok
Shukri
how do you save a country economic situation when it's falling apart
Lilia Reply
what is the difference between economic growth and development
Fiker Reply
Economic growth as an increase in the production and consumption of goods and services within an economy.but Economic development as a broader concept that encompasses not only economic growth but also social & human well being.
Shukri
production function means
Jabir
What do you think is more important to focus on when considering inequality ?
Abdisa Reply
any question about economics?
Awais Reply
sir...I just want to ask one question... Define the term contract curve? if you are free please help me to find this answer 🙏
Asui
it is a curve that we get after connecting the pareto optimal combinations of two consumers after their mutually beneficial trade offs
Awais
thank you so much 👍 sir
Asui
In economics, the contract curve refers to the set of points in an Edgeworth box diagram where both parties involved in a trade cannot be made better off without making one of them worse off. It represents the Pareto efficient allocations of goods between two individuals or entities, where neither p
Cornelius
In economics, the contract curve refers to the set of points in an Edgeworth box diagram where both parties involved in a trade cannot be made better off without making one of them worse off. It represents the Pareto efficient allocations of goods between two individuals or entities,
Cornelius
Suppose a consumer consuming two commodities X and Y has The following utility function u=X0.4 Y0.6. If the price of the X and Y are 2 and 3 respectively and income Constraint is birr 50. A,Calculate quantities of x and y which maximize utility. B,Calculate value of Lagrange multiplier. C,Calculate quantities of X and Y consumed with a given price. D,alculate optimum level of output .
Feyisa Reply
Answer
Feyisa
c
Jabir
the market for lemon has 10 potential consumers, each having an individual demand curve p=101-10Qi, where p is price in dollar's per cup and Qi is the number of cups demanded per week by the i th consumer.Find the market demand curve using algebra. Draw an individual demand curve and the market dema
Gsbwnw Reply
suppose the production function is given by ( L, K)=L¼K¾.assuming capital is fixed find APL and MPL. consider the following short run production function:Q=6L²-0.4L³ a) find the value of L that maximizes output b)find the value of L that maximizes marginal product
Abdureman
Got questions? Join the online conversation and get instant answers!
Jobilize.com Reply

Get Jobilize Job Search Mobile App in your pocket Now!

Get it on Google Play Download on the App Store Now


Source:  OpenStax, The art of the pfug. OpenStax CNX. Jun 05, 2013 Download for free at http://cnx.org/content/col10523/1.34
Google Play and the Google Play logo are trademarks of Google Inc.

Notification Switch

Would you like to follow the 'The art of the pfug' conversation and receive update notifications?

Ask