<< Chapter < Page Chapter >> Page >

This is written as the remainder (rem.) .

Begin with work in the number range of the tables (to tenth multiple). You will need much concrete work and lots of repetition, because it is very important that the learners understand what they are doing before you go on to larger numbers.

The learners must do research in books and pamphlets about the different traffic signs and discuss them before they complete the signs.

Many pictures and different objects with these shapes are required to ensure that the learners recognise all the shapes.

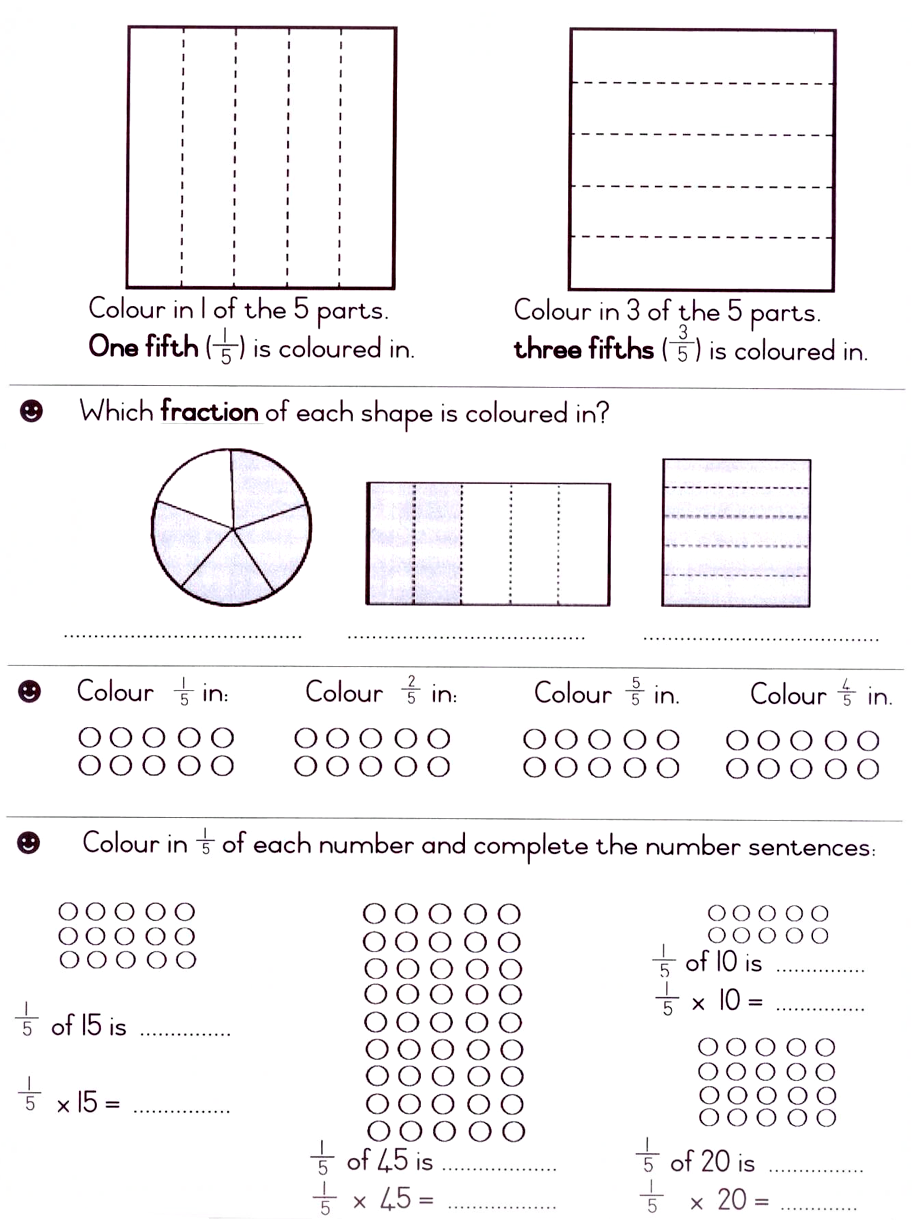
Make the learners aware of the fact that there is no easy way of folding or dividing for obtaining fifths of 2-D shapes. This must be determined by measuring .

It may be necessary to help the learners to determine the location of the first square that must be coloured in. Do not offer help if they are able to find it independently.

Encourage learners to tell where they live and how they would explain the route to their home to someone else. Help them to explain an easy route to find a certain room in the school.

Leaner section

Content

Activity: shapes [lo 1.4, lo 1.8, lo 3.1, lo 3.6]

Ken jy hierdie vorms?

pyramid, rectangular block, prism, sphere, cylinder, cube and cone.
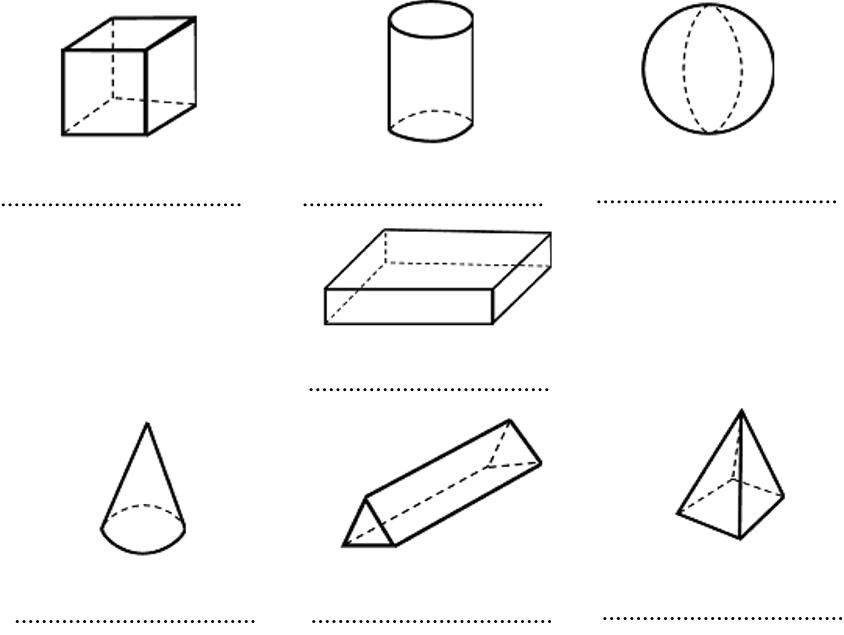
  • Match the words to the correct shapes.
  • Find pictures of objects in magazines and classify them according to their shapes. Write the name of at least one object for each shape.

pyramid:_____________________________________________________________

rectangular block:_____________________________________________________

prism:______________________________________________________________

sphere:_______________________________________________________________

cylinder:______________________________________________________________

cube: _______________________________________________________________

cone:________________________________________________________________

  • Cut out the pictures of objects that you have found in the magazine and paste them here.
  • Write the name of each object and the name of its shape.
  • Compare your work with the work of other learners in the class.
  • Use one of the following shapes and design a container for sweets: a cylinder , a pyramid , a cone or a prism . Decorate your container with circles, triangles and squares.
  • These squares have been divided into 5 equal parts .

Use any method to solve the problems. Show how you did it.

  • The bus has to travel 280 km in 4 hours. How many km must it travel in 1 hour?

Number sentence: ______________________________________________________

  • Mom had R200. She bought food for R65 and put fuel in the car for R1 10 rand. How much money is left over in her purse?

Number sentence: ______________________________________________________

  • Two kombi’s each transport 12 learners to school every day. How many learners do they transport in 4 days altogether?

Number sentence: ______________________________________________________

  • Granny has baked 1 10 cookies each day for the past 3 days. We have eaten 50. How many cookies are left over?

Number sentence: ______________________________________________________

  • I have a rope that is 2 m long. How many 10 cm pieces can I cut from it?

Number sentence: ______________________________________________________

  • Here is a street plan of the area where Bonny and Tommy live.

Colour the following squares to mark the route that the bus takes.

Down : Across

3 : 1 1, 1 2, 1 3, 1 4

4 : 1 1

5 : 1 1

6 : 1 1

7 : 1 1

8 : 3, 4, 5, 6, 7, 8, 9, 1 0, 1 1

1 5 : 3, 4, 5, 6, 7, 8, 9, 1 0, 1 1, 1 2, 1 3, 1 4, 1 5

Down : Across

9 : 3

1 0 : 3

1 1 : 3

1 2 : 3

1 3 : 3

1 4 : 3

  • If each square that you have coloured in represents 10 m , the bus travels ………………..m.
  • If each square represents 100 m , the bus travels …………………….. m.
  • How many km is this? Try to work it out! It is ……………………………. km.
  • Explain to a friend the route that the bus takes. Use the direction words left and right , as well as other information from the street plan. Now write the directions here:
  • Where do Bonny and Tommy live? Follow the directions and draw the route on the street plan as you go.

Walk along School Street as far as Short Street; turn left into Short Street; walk as far as the stop sign; turn right into Church Street; walk to Long Street and turn right again, into Long Street. They live on the left hand side of Long Street, in the 2nd house from the corner.

  • Colour in the square.
  • What is the number of their house?

(Square : Down : Across)? _______ : _______

Assessment

Learning Outcome 1: The learner will be able to recognise, describe and represent numbers and their relationships, and to count, estimate, calculate and check with competence and confidence in solving problems.

Assessment Standard 1.4: We know this when the learner orders, describes and compares numbers;

Assessment Standard 1.8: We know this when the learner can perform calculations, using appropriate symbols, to solve problems;

Learning Outcome 3: The learner will be able to describe and represent characteristics and relationships between two-dimensional shapes and three-dimensional objects in a variety of orientations and positions.

Assessment Standard 3.1: We know this when the learner recognises, identifies and names two-dimensional shapes and three-dimensional objects in the environment and in pictures.

Assessment Standard 3.6: We know this when the learner reads, interprets and draws informal maps of the school environment or of an arrangement of three-dimensional objects and locates objects on the map.

Questions & Answers

differentiate between demand and supply giving examples
Lambiv Reply
differentiated between demand and supply using examples
Lambiv
what is labour ?
Lambiv
how will I do?
Venny Reply
how is the graph works?I don't fully understand
Rezat Reply
information
Eliyee
devaluation
Eliyee
t
WARKISA
hi guys good evening to all
Lambiv
multiple choice question
Aster Reply
appreciation
Eliyee
explain perfect market
Lindiwe Reply
In economics, a perfect market refers to a theoretical construct where all participants have perfect information, goods are homogenous, there are no barriers to entry or exit, and prices are determined solely by supply and demand. It's an idealized model used for analysis,
Ezea
What is ceteris paribus?
Shukri Reply
other things being equal
AI-Robot
When MP₁ becomes negative, TP start to decline. Extuples Suppose that the short-run production function of certain cut-flower firm is given by: Q=4KL-0.6K2 - 0.112 • Where is quantity of cut flower produced, I is labour input and K is fixed capital input (K-5). Determine the average product of lab
Kelo
Extuples Suppose that the short-run production function of certain cut-flower firm is given by: Q=4KL-0.6K2 - 0.112 • Where is quantity of cut flower produced, I is labour input and K is fixed capital input (K-5). Determine the average product of labour (APL) and marginal product of labour (MPL)
Kelo
yes,thank you
Shukri
Can I ask you other question?
Shukri
what is monopoly mean?
Habtamu Reply
What is different between quantity demand and demand?
Shukri Reply
Quantity demanded refers to the specific amount of a good or service that consumers are willing and able to purchase at a give price and within a specific time period. Demand, on the other hand, is a broader concept that encompasses the entire relationship between price and quantity demanded
Ezea
ok
Shukri
how do you save a country economic situation when it's falling apart
Lilia Reply
what is the difference between economic growth and development
Fiker Reply
Economic growth as an increase in the production and consumption of goods and services within an economy.but Economic development as a broader concept that encompasses not only economic growth but also social & human well being.
Shukri
production function means
Jabir
What do you think is more important to focus on when considering inequality ?
Abdisa Reply
any question about economics?
Awais Reply
sir...I just want to ask one question... Define the term contract curve? if you are free please help me to find this answer 🙏
Asui
it is a curve that we get after connecting the pareto optimal combinations of two consumers after their mutually beneficial trade offs
Awais
thank you so much 👍 sir
Asui
In economics, the contract curve refers to the set of points in an Edgeworth box diagram where both parties involved in a trade cannot be made better off without making one of them worse off. It represents the Pareto efficient allocations of goods between two individuals or entities, where neither p
Cornelius
In economics, the contract curve refers to the set of points in an Edgeworth box diagram where both parties involved in a trade cannot be made better off without making one of them worse off. It represents the Pareto efficient allocations of goods between two individuals or entities,
Cornelius
Suppose a consumer consuming two commodities X and Y has The following utility function u=X0.4 Y0.6. If the price of the X and Y are 2 and 3 respectively and income Constraint is birr 50. A,Calculate quantities of x and y which maximize utility. B,Calculate value of Lagrange multiplier. C,Calculate quantities of X and Y consumed with a given price. D,alculate optimum level of output .
Feyisa Reply
Answer
Feyisa
c
Jabir
the market for lemon has 10 potential consumers, each having an individual demand curve p=101-10Qi, where p is price in dollar's per cup and Qi is the number of cups demanded per week by the i th consumer.Find the market demand curve using algebra. Draw an individual demand curve and the market dema
Gsbwnw Reply
suppose the production function is given by ( L, K)=L¼K¾.assuming capital is fixed find APL and MPL. consider the following short run production function:Q=6L²-0.4L³ a) find the value of L that maximizes output b)find the value of L that maximizes marginal product
Abdureman
types of unemployment
Yomi Reply
What is the difference between perfect competition and monopolistic competition?
Mohammed
Got questions? Join the online conversation and get instant answers!
Jobilize.com Reply

Get Jobilize Job Search Mobile App in your pocket Now!

Get it on Google Play Download on the App Store Now


Source:  OpenStax, Mathematics grade 3. OpenStax CNX. Oct 14, 2009 Download for free at http://cnx.org/content/col11128/1.1
Google Play and the Google Play logo are trademarks of Google Inc.

Notification Switch

Would you like to follow the 'Mathematics grade 3' conversation and receive update notifications?

Ask