<< Chapter < Page Chapter >> Page >

We then plot the results on a 2-D plane using imagesc() . This function associates colors with the values in the matrix, so that you can see where the values in the matrix are larger. Thus we get a pretty picture as above.

Testing the spectrogram

For the first test, we will try a simple sin wave.

For the second test, we will use a more interesting function. Below we have plotted sin ( 6 * 2 π t ) + sin ( 20 * 2 π t ) + 2 * sin ( e t / 1 . 5 ) over [ 0 , 10 ] .

a dog on a bed
An interesting signal to decompose.

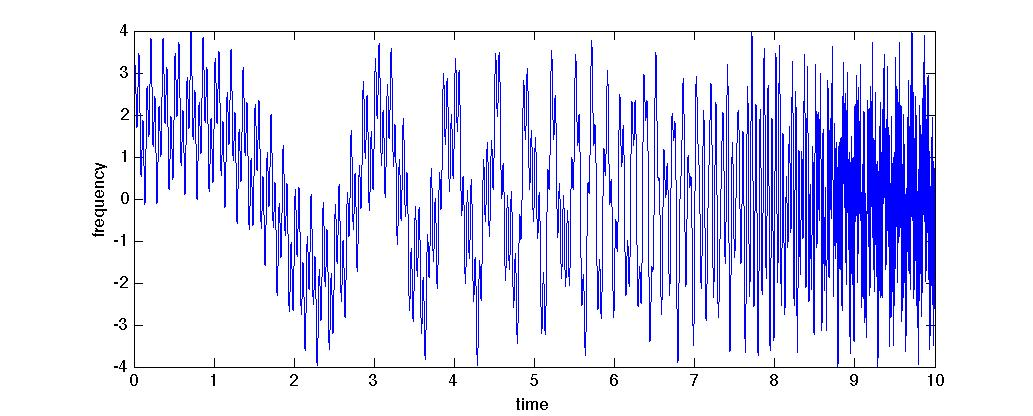
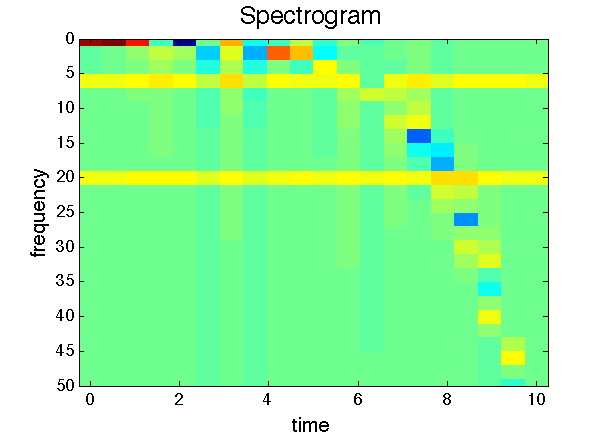
This function is interesting because it contains a frequency component that is changing over time. While we have waves at a constant 6 and 20 Hertz, the third component speeds up as t gets larger and the exponential curve gets steeper. Thus for the plot we expect to see a frequency component that is increasing. This is exactly what we see in [link] –two constant bands of frequency, and one train of frequency that increases with time.

>> dt = 1e-4;>> t = 0:sr:10;>> y = sin(6*2*pi*t)+sin(20*2*pi*t)+2*sin(exp(t/1.5));>> my_stft(y, dt, 5000);
a dog on a bed
The spectrogram of the above function

Application to eeg data

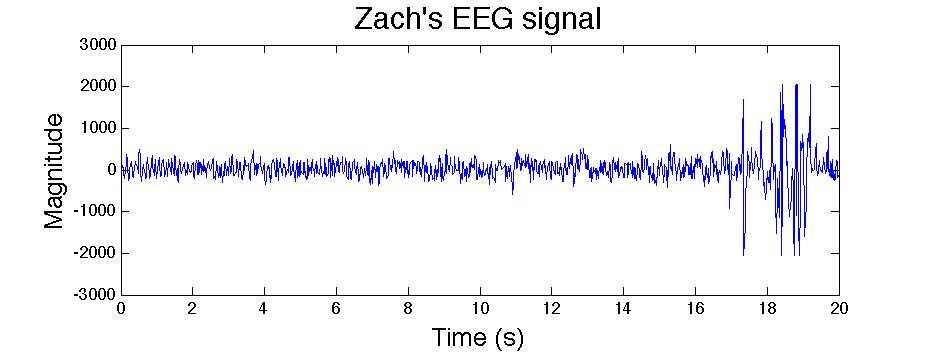
For the final section, we will analyze actual brain waves. We recorded from and EEG, and got the signal in [link] .

a dog on a bed
An EEG wave.

To analyze, we find the time-step in the data, then call mysgram(). This gives us the plot below.

a dog on a bed

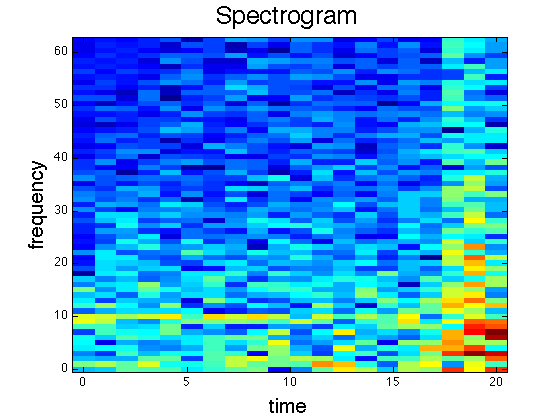
Compare the spectrogram to the raw signal. What do you notice? Perhaps the most notable change is the significant increase in signal magnitude near 18 seconds. This is reflected in the spectrogram with the brighter colors. Also, several "dominant" frequencies emerge. Two faint bands appear at 10 Hz 4 Hz for the first half of the signal. In the last section, a cluster of frequencies between 6 and 10 Hz dominate. Many of the patterns are hidden behind the subtleties in the data, however. Decoding the spectrogram is at least as difficult and creating it. Indeed, it is much less defined. The next section will explore these rules in the context of an interesting application.

Application: driving a car

One application of decoding brain waves is giving commands to a machine via brainwaves. To see developing work in this field, see this video of the company NeuroSky. Of the many machines we could command, we choose here to command a virtual car (some assembly required) that goes left or right. As above, the decision rule for such a program is not obvious. As a first try, we can find the strongest frequency for each time section and compare it to a set value. If it is lower, the car moves left, and if higher, the car moves right. The following code implements this rule:

   %load dataload bwave N = numel(eeg_sig);win_len = 3 * round(N / 60); n = 0;freq_criterion = 8; while (n+3) * win_len / 3<= N %for each time window %define the moving window and isolate that piece of signalsig_win = eeg_sig(round(n * win_len / 3) + (1:win_len));%perform fourier analysis [freq raw_amps]= myfourier(sig_win, dt, 1); %only take positive frequenciesfreq = freq((end/2+1):end); %add sine and cosine entries togethefamps = abs(sum(raw_amps(end/2:end,1), 2));%find the maximum one [a idx]= max(amps);%find the frequency corresponding to the max amplitude max_freq = freq(idx);%decided which way the car should move based on the max frequencyif max_freq<freq_criterion; fprintf('Moving left.... (fmax = %f)\n', max_freq);%this is where we put animation code elsefprintf('Moving right.....(fmax = %f)\n', max_freq); %this is where we put animation codeendpause(.5); %for dramatic effect :) n = n + 1;end

Questions & Answers

differentiate between demand and supply giving examples
Lambiv Reply
differentiated between demand and supply using examples
Lambiv
what is labour ?
Lambiv
how will I do?
Venny Reply
how is the graph works?I don't fully understand
Rezat Reply
information
Eliyee
devaluation
Eliyee
t
WARKISA
hi guys good evening to all
Lambiv
multiple choice question
Aster Reply
appreciation
Eliyee
explain perfect market
Lindiwe Reply
In economics, a perfect market refers to a theoretical construct where all participants have perfect information, goods are homogenous, there are no barriers to entry or exit, and prices are determined solely by supply and demand. It's an idealized model used for analysis,
Ezea
What is ceteris paribus?
Shukri Reply
other things being equal
AI-Robot
When MP₁ becomes negative, TP start to decline. Extuples Suppose that the short-run production function of certain cut-flower firm is given by: Q=4KL-0.6K2 - 0.112 • Where is quantity of cut flower produced, I is labour input and K is fixed capital input (K-5). Determine the average product of lab
Kelo
Extuples Suppose that the short-run production function of certain cut-flower firm is given by: Q=4KL-0.6K2 - 0.112 • Where is quantity of cut flower produced, I is labour input and K is fixed capital input (K-5). Determine the average product of labour (APL) and marginal product of labour (MPL)
Kelo
yes,thank you
Shukri
Can I ask you other question?
Shukri
what is monopoly mean?
Habtamu Reply
What is different between quantity demand and demand?
Shukri Reply
Quantity demanded refers to the specific amount of a good or service that consumers are willing and able to purchase at a give price and within a specific time period. Demand, on the other hand, is a broader concept that encompasses the entire relationship between price and quantity demanded
Ezea
ok
Shukri
how do you save a country economic situation when it's falling apart
Lilia Reply
what is the difference between economic growth and development
Fiker Reply
Economic growth as an increase in the production and consumption of goods and services within an economy.but Economic development as a broader concept that encompasses not only economic growth but also social & human well being.
Shukri
production function means
Jabir
What do you think is more important to focus on when considering inequality ?
Abdisa Reply
any question about economics?
Awais Reply
sir...I just want to ask one question... Define the term contract curve? if you are free please help me to find this answer 🙏
Asui
it is a curve that we get after connecting the pareto optimal combinations of two consumers after their mutually beneficial trade offs
Awais
thank you so much 👍 sir
Asui
In economics, the contract curve refers to the set of points in an Edgeworth box diagram where both parties involved in a trade cannot be made better off without making one of them worse off. It represents the Pareto efficient allocations of goods between two individuals or entities, where neither p
Cornelius
In economics, the contract curve refers to the set of points in an Edgeworth box diagram where both parties involved in a trade cannot be made better off without making one of them worse off. It represents the Pareto efficient allocations of goods between two individuals or entities,
Cornelius
Suppose a consumer consuming two commodities X and Y has The following utility function u=X0.4 Y0.6. If the price of the X and Y are 2 and 3 respectively and income Constraint is birr 50. A,Calculate quantities of x and y which maximize utility. B,Calculate value of Lagrange multiplier. C,Calculate quantities of X and Y consumed with a given price. D,alculate optimum level of output .
Feyisa Reply
Answer
Feyisa
c
Jabir
the market for lemon has 10 potential consumers, each having an individual demand curve p=101-10Qi, where p is price in dollar's per cup and Qi is the number of cups demanded per week by the i th consumer.Find the market demand curve using algebra. Draw an individual demand curve and the market dema
Gsbwnw Reply
suppose the production function is given by ( L, K)=L¼K¾.assuming capital is fixed find APL and MPL. consider the following short run production function:Q=6L²-0.4L³ a) find the value of L that maximizes output b)find the value of L that maximizes marginal product
Abdureman
types of unemployment
Yomi Reply
What is the difference between perfect competition and monopolistic competition?
Mohammed
Got questions? Join the online conversation and get instant answers!
Jobilize.com Reply

Get Jobilize Job Search Mobile App in your pocket Now!

Get it on Google Play Download on the App Store Now


Source:  OpenStax, The art of the pfug. OpenStax CNX. Jun 05, 2013 Download for free at http://cnx.org/content/col10523/1.34
Google Play and the Google Play logo are trademarks of Google Inc.

Notification Switch

Would you like to follow the 'The art of the pfug' conversation and receive update notifications?

Ask