| << Chapter < Page | Chapter >> Page > |
The time series in the bottom plot is the product of the time series in the first and fourth plots.
Once again, this time series is the sum of two sinusoids. The frequency of one is the difference between the two original frequencies. The frequency of theother is the sum of the two original frequencies.
However, in this case, the difference frequency is not zero . Rather, it is a very low frequency. What you see in the bottom plot of Figure 1 is a sinusoid whose frequency is the sum of the two original frequencies addedto a sinusoid whose frequency is the difference between the two original frequencies. Because the two original frequencies were almost equal, thefrequency of the second sinusoid is very low.
As you can see, the low-frequency component in the bottom plot in Figure 1 appears to be the beginning of a cosine function whose period is much greaterthan the width of the plot (400 points).
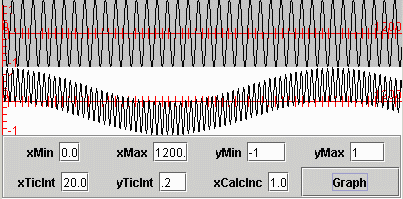
Figure 2 shows another view of the bottom two plots from Figure 1 .
| Figure 2. Products of sinusoids. |
|---|
 |
The difference between Figure 2 and Figure 1 is that while Figure 1 shows only 400 points along the x-axis, Figure 2 shows 1200 points along the x-axis. Thus, the horizontal scale in Figure 2 is significantly compressed relative to the horizontal scale in Figure 1 .
Figure 2 lets you see a little more than one full cycle of the low-frequency component of the time series produced by multiplying the two sinusoids.
( Figure 2 does not provide a very good representation of the high-frequency component. This is because I plotted 1200 points in a part ofthe screen that is only 400 pixels wide. On my computer, I can expand this to the full screen width. However, I can't publish it at that width, so Ipublished the 400-pixel version.)
Later on, we will compute the average value of the time series represented by the bottom plot in Figures 1 and 2. Ideally, that average value will be zero.However, you have probably already figured out that a great many data points must be included in the computation of the average to get anything near zero. Aneyeball estimate indicates that about 900 data points are required just to include a single cycle of the low-frequency component.
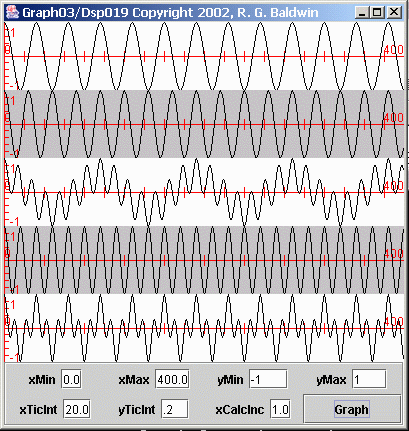
Figure 3 shows two additional time series created by multiplying sinusoids.
| Figure 3. More products of sinusoids. |
|---|
 |
The arrangement in Figure 3 is the same as in Figure 1 . The top plot in Figure 3 is the same sinusoid shown in the top plot of Figure 1 . This is a sinusoid with 32 samples per cycle.
Immediately below the top sinusoid in Figure 3 is another sinusoid. This sinusoid has 24 samples per cycle. As you can see, the frequency of thissinusoid is a little higher than the frequency of the sinusoid in the top plot.
The time series in the third plot down from the top is the product of the time series in the top two plots. Again, this time series is composed of two newsinusoids whose frequencies are the sum of and difference between the two original frequencies.

Notification Switch
Would you like to follow the 'Digital signal processing - dsp' conversation and receive update notifications?