<< Chapter < Page Chapter >> Page >
B 1 = A 1 , and for any i > 1 , B i = A i A 1 c A 2 c A i - 1 c

Thus each B i is the set of those elements of A i not in any of the previous members of the sequence.

This representation is used to show that subadditivity (P9) follows from countable additivity and property (P6) . Since each B i A i , by (P6) P ( B i ) P ( A i ) . Now

P i = 1 A i = P i = 1 B i = i = 1 P ( B i ) i = 1 P ( A i )

The representation of a union as a disjoint union points to an important strategy in the solution of probability problems. If an event can be expressed as a countable disjointunion of events, each of whose probabilities is known, then the probability of the combination is the sum of the individual probailities. In in the module on Partitions and Minterms , we show that any Boolean combination of a finite class of events can be expressed as a disjoint union in a manner that often facilitates systematic determination of the probabilities.

The indicator function

One of the most useful tools for dealing with set combinations (and hence with event combinations) is the indicator function I E for a set E Ω . It is defined very simply as follows:

I E ( ω ) = 1 for ω E 0 for ω E c

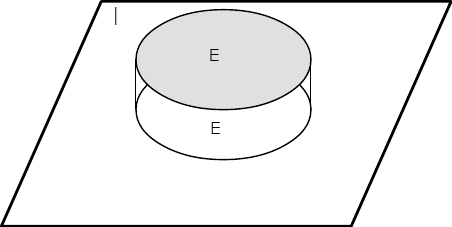
Remark . Indicator fuctions may be defined on any domain. We have occasion in various cases to define them on the real line and on higher dimensionalEuclidean spaces. For example, if M is the interval [ a , b ] on the real line then I M ( t ) = 1 for each t in the interval (and is zero otherwise). Thus we have a step function with unit value over the interval M . In the abstract basic space Ω we cannot draw a graph so easily. However, with the representation of sets on a Venn diagram, we can give a schematic representation, as in [link] .

A cylinder with an E on both circular bases. The cylinder is setting on a square inclined plane with an 'I' in the top right corner. A cylinder with an E on both circular bases. The cylinder is setting on a square inclined plane with an 'I' in the top right corner.
Representation of the indicator function I E for event E .

Much of the usefulness of the indicator function comes from the following properties.

  • I A I B iff A B . If I A I B , then ω A implies I A ( ω ) = I B ( ω ) = 1 , so ω B . If A B , then I A ( ω ) = 1 implies ω A implies ω B implies I B ( ω ) = 1 .
  • I A = I B iff A = B
    A = B iff both A B and B A iff I A I B and I B I A iff I A = I B
  • I A c = 1 - I A This follows from the fact I A c ( ω ) = 1 iff I A ( ω ) = 0 .
  • I A B = I A I B = min { I A , I B } (extends to any class) An element ω belongs to the intersection iff it belongs to all iff the indicator function for each event is one iff the product of the indicator functions is one.
  • I A B = I A + I B - I A I B = max { I A , I B } (the maximum rule extends to any class)The maximum rule follows from the fact that ω is in the union iff it is in any one or more of the events in the union iff any one or more of the individual indicator function has value oneiff the maximum is one. The sum rule for two events is established by DeMorgan's rule and properties (IF2), (IF3), and (IF4).
    I A B = 1 - I A c B c = 1 - [ 1 - I A ] [ 1 - I B ] = 1 - 1 + I B + I A - I A I B
  • If the pair { A , B } is disjoint, I A B = I A + I B (extends to any disjoint class)

The following example illustrates the use of indicator functions in establishing relationships between set combinations. Other uses and techniques are established in the module on Partitions and Minterms .

Indicator functions and set combinations

Suppose { A i : 1 i n } is a partition.

If B = i = 1 n A i C i , then B c = i = 1 n A i C i c

VERIFICATION

Utilizing properties of the indicator function established above, we have

I B = i = 1 n I A i I C i

Note that since the A i form a partition, we have i = 1 n I A i = 1 , so that the indicator function for the complementary event is

I B c = 1 - i = 1 n I A i I C i = i = 1 n I A i - i = 1 n I A i I C i = i = 1 n I A i [ 1 - I C i ] = i = 1 n I A i I C i c

The last sum is the indicator function for i = 1 n A i C i c .

Got questions? Get instant answers now!

A technical comment on the class of events

The class of events plays a central role in the intuitive background, the application, and the formal mathematical structure. Events have been modeled as subsets of the basic space ofall possible outcomes of the trial or experiment. In the case of a finite number of outcomes, any subset can be taken as an event. In the general theory, involving infinite possibilities, there are some technical mathematical reasons for limiting the class of subsets to beconsidered as events. The practical needs are these:

  1. If A is an event, its complementary set must also be an event.
  2. If { A i : i J } is a finite or countable class of events, the union and the intersection of members of the class need to be events.

A simple argument based on DeMorgan's rules shows that if the class contains complements of all its sets and countable unions, then itcontains countable intersections. Likewise, if it contains complements of all its sets and countable intersections, then it contains countable unions. A class of sets closedunder complements and countable unions is known as a sigma algebra of sets. In a formal, measure-theoretic treatment, a basic assumption is that the class of eventsis a sigma algebra and the probability measure assigns probabilities to members of that class. Such a class is so general that it takes very sophisticated arguments to establish the factthat such a class does not contain all subsets. But precisely because the class is so general and inclusive in ordinary applications we need not be concerned about which sets are permissible as events

A primary task in formulating a probability problem is identifying the appropriate events and the relationships between them. The theoretical treatment shows that we may work withgreat freedom in forming events, with the assurrance that in most applications a set so produced is a mathematically valid event. The so called measurability question only comes into play in dealing with random processes with continuous parameters. Even there,under reasonable assumptions, the sets produced will be events.

Questions & Answers

differentiate between demand and supply giving examples
Lambiv Reply
differentiated between demand and supply using examples
Lambiv
what is labour ?
Lambiv
how will I do?
Venny Reply
how is the graph works?I don't fully understand
Rezat Reply
information
Eliyee
devaluation
Eliyee
t
WARKISA
hi guys good evening to all
Lambiv
multiple choice question
Aster Reply
appreciation
Eliyee
explain perfect market
Lindiwe Reply
In economics, a perfect market refers to a theoretical construct where all participants have perfect information, goods are homogenous, there are no barriers to entry or exit, and prices are determined solely by supply and demand. It's an idealized model used for analysis,
Ezea
What is ceteris paribus?
Shukri Reply
other things being equal
AI-Robot
When MP₁ becomes negative, TP start to decline. Extuples Suppose that the short-run production function of certain cut-flower firm is given by: Q=4KL-0.6K2 - 0.112 • Where is quantity of cut flower produced, I is labour input and K is fixed capital input (K-5). Determine the average product of lab
Kelo
Extuples Suppose that the short-run production function of certain cut-flower firm is given by: Q=4KL-0.6K2 - 0.112 • Where is quantity of cut flower produced, I is labour input and K is fixed capital input (K-5). Determine the average product of labour (APL) and marginal product of labour (MPL)
Kelo
yes,thank you
Shukri
Can I ask you other question?
Shukri
what is monopoly mean?
Habtamu Reply
What is different between quantity demand and demand?
Shukri Reply
Quantity demanded refers to the specific amount of a good or service that consumers are willing and able to purchase at a give price and within a specific time period. Demand, on the other hand, is a broader concept that encompasses the entire relationship between price and quantity demanded
Ezea
ok
Shukri
how do you save a country economic situation when it's falling apart
Lilia Reply
what is the difference between economic growth and development
Fiker Reply
Economic growth as an increase in the production and consumption of goods and services within an economy.but Economic development as a broader concept that encompasses not only economic growth but also social & human well being.
Shukri
production function means
Jabir
What do you think is more important to focus on when considering inequality ?
Abdisa Reply
any question about economics?
Awais Reply
sir...I just want to ask one question... Define the term contract curve? if you are free please help me to find this answer 🙏
Asui
it is a curve that we get after connecting the pareto optimal combinations of two consumers after their mutually beneficial trade offs
Awais
thank you so much 👍 sir
Asui
In economics, the contract curve refers to the set of points in an Edgeworth box diagram where both parties involved in a trade cannot be made better off without making one of them worse off. It represents the Pareto efficient allocations of goods between two individuals or entities, where neither p
Cornelius
In economics, the contract curve refers to the set of points in an Edgeworth box diagram where both parties involved in a trade cannot be made better off without making one of them worse off. It represents the Pareto efficient allocations of goods between two individuals or entities,
Cornelius
Suppose a consumer consuming two commodities X and Y has The following utility function u=X0.4 Y0.6. If the price of the X and Y are 2 and 3 respectively and income Constraint is birr 50. A,Calculate quantities of x and y which maximize utility. B,Calculate value of Lagrange multiplier. C,Calculate quantities of X and Y consumed with a given price. D,alculate optimum level of output .
Feyisa Reply
Answer
Feyisa
c
Jabir
the market for lemon has 10 potential consumers, each having an individual demand curve p=101-10Qi, where p is price in dollar's per cup and Qi is the number of cups demanded per week by the i th consumer.Find the market demand curve using algebra. Draw an individual demand curve and the market dema
Gsbwnw Reply
suppose the production function is given by ( L, K)=L¼K¾.assuming capital is fixed find APL and MPL. consider the following short run production function:Q=6L²-0.4L³ a) find the value of L that maximizes output b)find the value of L that maximizes marginal product
Abdureman
types of unemployment
Yomi Reply
What is the difference between perfect competition and monopolistic competition?
Mohammed
Got questions? Join the online conversation and get instant answers!
Jobilize.com Reply

Get Jobilize Job Search Mobile App in your pocket Now!

Get it on Google Play Download on the App Store Now


Source:  OpenStax, Applied probability. OpenStax CNX. Aug 31, 2009 Download for free at http://cnx.org/content/col10708/1.6
Google Play and the Google Play logo are trademarks of Google Inc.

Notification Switch

Would you like to follow the 'Applied probability' conversation and receive update notifications?

Ask