<< Chapter < Page Chapter >> Page >

There is nothing new in Listing 8 . You should be able to correlate the code in Listing 8 and the drawing parameters in Listing 7 with the steps presented earlier to understand how the program named Parabola01 produces the output image shown in Figure 6 .

A cubic

The program named Cubic01 shown in Listing 17 produces the graphic output shown in Figure 9

Figure 9. Graphic output from the program named Cubic01.

Missing image

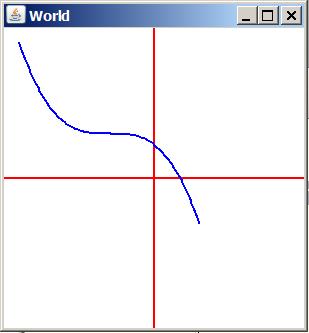
About the only thing that is different between the program named Parabola01 and the program named Cubic01 is the methodnamed function . In the program named Parabola01 , the method computes and returns the square of the incoming x-value. In theprogram named Cubic01 , the method computes and returns the cube of the incoming x-value. Just about everything that was said about Parabola01 also applies to Cubic01 .

A circle

There are several ways to graph all of the functions discussed in this lesson. The previous sections have illustrated only one way -- using a turtle tograph the function. I will illustrate the following two ways to graph a circle in this section and will compare some of the advantages and disadvantages of each approach :

  • Using a turtle to graph the function
  • Accessing and setting pixel colors

First approach

The first approach that I will present and explain uses a turtle to graph a circle. This program is very similar to the program named Parabola01 , but there are a few differences. I will explain those differences.

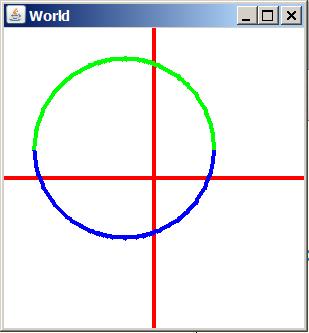
The program named Circle01 shown in Listing 18 produces the graphic output shown in Figure 10 .

Figure 10. Graphic output from the program named Circle01.

Missing image

The first difference that is worthy of note is shown by the lines of code involving the variable named rVal in Listing 9 .

Listing 9 . The variable named rVal. double rVal = 0.6;//radius relative to 1.0 double yVal = 0;int row = 0; int col = 0;double xVal = -rVal; double xInc = 2*rVal/100;turtle.setPenColor(Color.BLUE);

The variable named rVal is used to specify the radius of the circle relative to a value of 1.0 as declared and initialized in Listing 9 .

In the previous sections, we have evaluated our equation for a set of 101 x values ranging from -1.0 to +1.0. For the case of the circle, we will evaluatethe equation for a set of 101 x values ranging from -rVal to +rVal . ( There is no point in evaluating the equation outside of the circle.)

The code in Listing 9 declares and initializes the variable named rVal . Further down, the code sets the initial value for xVal to -rVal . Below that, the code sets the x-increment ( xInc ) to the diameter of the circle divided by 100. This will cause the equation for the circle to beevaluated at 101 points from left to right across the circle shown in Figure 10 .

The method named function for Circle01

The method named function is shown in Listing 10 .

This method evaluates and returns the y-value for each incoming x-value for a circle with no offset, centered at the origin.The method evaluates the standard equation for a circle given by

radius*radius = x*x + y*y

Note that unlike the function method for Parabola01 and Cubic01 , this method requires two incoming parameters: the radius and the current x-value.

Questions & Answers

What are the factors that affect demand for a commodity
Florence Reply
differentiate between demand and supply giving examples
Lambiv Reply
differentiated between demand and supply using examples
Lambiv
what is labour ?
Lambiv
how will I do?
Venny Reply
how is the graph works?I don't fully understand
Rezat Reply
information
Eliyee
devaluation
Eliyee
t
WARKISA
hi guys good evening to all
Lambiv
multiple choice question
Aster Reply
appreciation
Eliyee
explain perfect market
Lindiwe Reply
In economics, a perfect market refers to a theoretical construct where all participants have perfect information, goods are homogenous, there are no barriers to entry or exit, and prices are determined solely by supply and demand. It's an idealized model used for analysis,
Ezea
What is ceteris paribus?
Shukri Reply
other things being equal
AI-Robot
When MP₁ becomes negative, TP start to decline. Extuples Suppose that the short-run production function of certain cut-flower firm is given by: Q=4KL-0.6K2 - 0.112 • Where is quantity of cut flower produced, I is labour input and K is fixed capital input (K-5). Determine the average product of lab
Kelo
Extuples Suppose that the short-run production function of certain cut-flower firm is given by: Q=4KL-0.6K2 - 0.112 • Where is quantity of cut flower produced, I is labour input and K is fixed capital input (K-5). Determine the average product of labour (APL) and marginal product of labour (MPL)
Kelo
yes,thank you
Shukri
Can I ask you other question?
Shukri
what is monopoly mean?
Habtamu Reply
What is different between quantity demand and demand?
Shukri Reply
Quantity demanded refers to the specific amount of a good or service that consumers are willing and able to purchase at a give price and within a specific time period. Demand, on the other hand, is a broader concept that encompasses the entire relationship between price and quantity demanded
Ezea
ok
Shukri
how do you save a country economic situation when it's falling apart
Lilia Reply
what is the difference between economic growth and development
Fiker Reply
Economic growth as an increase in the production and consumption of goods and services within an economy.but Economic development as a broader concept that encompasses not only economic growth but also social & human well being.
Shukri
production function means
Jabir
What do you think is more important to focus on when considering inequality ?
Abdisa Reply
any question about economics?
Awais Reply
sir...I just want to ask one question... Define the term contract curve? if you are free please help me to find this answer 🙏
Asui
it is a curve that we get after connecting the pareto optimal combinations of two consumers after their mutually beneficial trade offs
Awais
thank you so much 👍 sir
Asui
In economics, the contract curve refers to the set of points in an Edgeworth box diagram where both parties involved in a trade cannot be made better off without making one of them worse off. It represents the Pareto efficient allocations of goods between two individuals or entities, where neither p
Cornelius
In economics, the contract curve refers to the set of points in an Edgeworth box diagram where both parties involved in a trade cannot be made better off without making one of them worse off. It represents the Pareto efficient allocations of goods between two individuals or entities,
Cornelius
Suppose a consumer consuming two commodities X and Y has The following utility function u=X0.4 Y0.6. If the price of the X and Y are 2 and 3 respectively and income Constraint is birr 50. A,Calculate quantities of x and y which maximize utility. B,Calculate value of Lagrange multiplier. C,Calculate quantities of X and Y consumed with a given price. D,alculate optimum level of output .
Feyisa Reply
Answer
Feyisa
c
Jabir
the market for lemon has 10 potential consumers, each having an individual demand curve p=101-10Qi, where p is price in dollar's per cup and Qi is the number of cups demanded per week by the i th consumer.Find the market demand curve using algebra. Draw an individual demand curve and the market dema
Gsbwnw Reply
suppose the production function is given by ( L, K)=L¼K¾.assuming capital is fixed find APL and MPL. consider the following short run production function:Q=6L²-0.4L³ a) find the value of L that maximizes output b)find the value of L that maximizes marginal product
Abdureman
Got questions? Join the online conversation and get instant answers!
Jobilize.com Reply

Get Jobilize Job Search Mobile App in your pocket Now!

Get it on Google Play Download on the App Store Now


Source:  OpenStax, Object-oriented programming (oop) with java. OpenStax CNX. Jun 29, 2016 Download for free at https://legacy.cnx.org/content/col11441/1.201
Google Play and the Google Play logo are trademarks of Google Inc.

Notification Switch

Would you like to follow the 'Object-oriented programming (oop) with java' conversation and receive update notifications?

Ask