The pressure and temperature axes on this phase diagram of carbon dioxide are not drawn to constant scale in order to illustrate several important properties.
Determining the state of carbon dioxide
Using the phase diagram for carbon dioxide shown in
[link] , determine the state of CO
2 at the following temperatures and pressures:
(a) −30 °C and 2000 kPa
(b) −60 °C and 1000 kPa
(c) −60 °C and 100 kPa
(d) 20 °C and 1500 kPa
(e) 0 °C and 100 kPa
(f) 20 °C and 100 kPa
Solution
Using the phase diagram for carbon dioxide provided, we can determine that the state of CO
2 at each temperature and pressure given are as follows: (a) liquid; (b) solid; (c) gas; (d) liquid; (e) gas; (f) gas.
Check your learning
Determine the phase changes carbon dioxide undergoes when its temperature is varied, thus holding its pressure constant at 1500 kPa? At 500 kPa? At what approximate temperatures do these phase changes occur?
If we place a sample of water in a sealed container at 25 °C, remove the air, and let the vaporization-condensation equilibrium establish itself, we are left with a mixture of liquid water and water vapor at a pressure of 0.03 atm. A distinct boundary between the more dense liquid and the less dense gas is clearly observed. As we increase the temperature, the pressure of the water vapor increases, as described by the liquid-gas curve in the phase diagram for water (
[link] ), and a two-phase equilibrium of liquid and gaseous phases remains. At a temperature of 374 °C, the vapor pressure has risen to 218 atm, and any further increase in temperature results in the disappearance of the boundary between liquid and vapor phases. All of the water in the container is now present in a single phase whose physical properties are intermediate between those of the gaseous and liquid states. This phase of matter is called a
supercritical fluid , and the temperature and pressure above which this phase exists is the
critical point (
[link] ). Above its critical temperature, a gas cannot be liquefied no matter how much pressure is applied. The pressure required to liquefy a gas at its critical temperature is called the critical pressure. The critical temperatures and critical pressures of some common substances are given in
[link] .
Substance
Critical Temperature (K)
Critical Pressure (atm)
hydrogen
33.2
12.8
nitrogen
126.0
33.5
oxygen
154.3
49.7
carbon dioxide
304.2
73.0
ammonia
405.5
111.5
sulfur dioxide
430.3
77.7
water
647.1
217.7
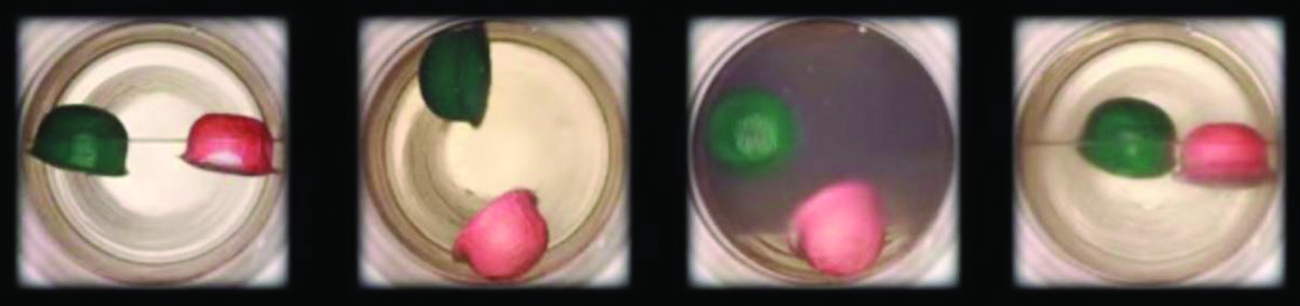
(a) A sealed container of liquid carbon dioxide slightly below its critical point is heated, resulting in (b) the formation of the supercritical fluid phase. Cooling the supercritical fluid lowers its temperature and pressure below the critical point, resulting in the reestablishment of separate liquid and gaseous phases (c and d). Colored floats illustrate differences in density between the liquid, gaseous, and supercritical fluid states. (credit: modification of work by “mrmrobin”/YouTube)
is it possible to leave every good at the same level
Joseph
I don't think so. because check it, if the demand for chicken increases, people will no longer consume fish like they used to causing a fall in the demand for fish
Anuolu
is not really possible to let the value of a goods to be same at the same time.....
Salome
Suppose the inflation rate is 6%, does it mean that all the goods you purchase will cost
6% more than previous year? Provide with reasoning.
Not necessarily. To measure the inflation rate economists normally use an averaged price index of a basket of certain goods. So if you purchase goods included in the basket, you will notice that you pay 6% more, otherwise not necessarily.
Good day
How do I calculate this question: C= 100+5yd G= 2000 T= 2000 I(planned)=200.
Suppose the actual output is 3000. What is the level of planned expenditures at this level of output?
I am Camara from Guinea west Africa... happy to meet you guys here
Sekou
ma management ho
Amisha
ahile becheclor ho
Amisha
hjr ktm bta ho
ani k kaam grnu hunxa tw
Amisha
belatari
Amisha
1st year ho
Amisha
nd u
Amisha
ahh
Amisha
kaha biratnagar
Amisha
ys
Amisha
kina k vo
Amisha
money as unit of account means what?
Kalombe
A unit of account is something that can be used to value goods and services and make calculations
Jim
all of you please speak in English I can't understand you're language
Muhammad
I want to know how can we define macroeconomics in one line
Muhammad
it must be .9 or 0.9
no Mpc is greater than 1
Y=100+.9Y+50
Y-.9Y=150
0.1Y/0.1=150/0.1
Y=1500
Kalombe
Mercy is it clear?😋
Kalombe
hi can someone help me on this question
If a negative shocks shifts the IS curve to the left, what type of policy do you suggest so as to stabilize the level of output?
discuss your answer using appropriate graph.