<< Chapter < Page Chapter >> Page >
By the end of this section, you will be able to:
  • Explain the construction and use of a typical phase diagram
  • Use phase diagrams to identify stable phases at given temperatures and pressures, and to describe phase transitions resulting from changes in these properties
  • Describe the supercritical fluid phase of matter

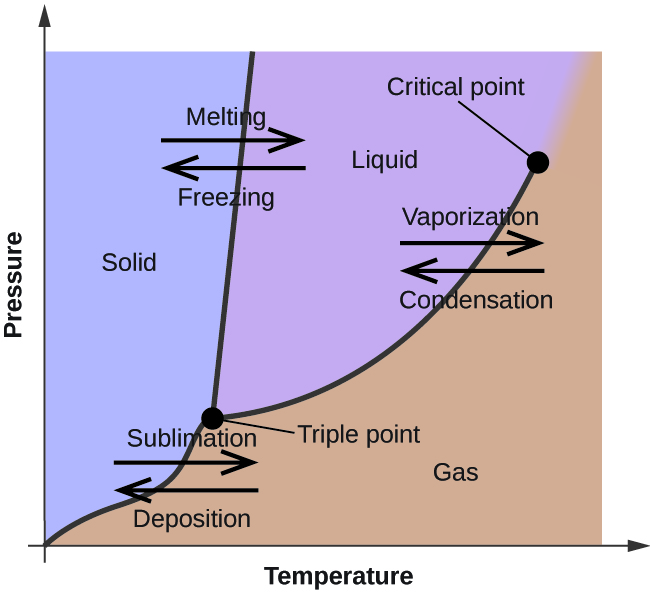
In the previous module, the variation of a liquid’s equilibrium vapor pressure with temperature was described. Considering the definition of boiling point, plots of vapor pressure versus temperature represent how the boiling point of the liquid varies with pressure. Also described was the use of heating and cooling curves to determine a substance’s melting (or freezing) point. Making such measurements over a wide range of pressures yields data that may be presented graphically as a phase diagram. A phase diagram    combines plots of pressure versus temperature for the liquid-gas, solid-liquid, and solid-gas phase-transition equilibria of a substance. These diagrams indicate the physical states that exist under specific conditions of pressure and temperature, and also provide the pressure dependence of the phase-transition temperatures (melting points, sublimation points, boiling points). A typical phase diagram for a pure substance is shown in [link] .

A graph is shown where the x-axis is labeled “Temperature” and the y-axis is labeled “Pressure.” A line extends from the lower left bottom of the graph sharply upward to a point that is a third across the x-axis. A second line begins at the lower third of the first line at a point labeled “triple point” and extends to the upper right corner of the graph where it is labeled “critical point.” The two lines bisect the graph area to create three sections, labeled “solid” near the top left, “liquid” in the top middle and “gas” near the bottom right. A pair of horizontal arrows, one left-facing and labeled “deposition” and one right-facing and labeled” sublimation,” are drawn on top of the bottom section of the first line. A second pair of horizontal arrows, one left-facing and labeled “freezing” and one right-facing and labeled “melting”, are drawn on top of the upper section of the first line. A third pair of horizontal arrows, one left-facing and labeled “condensation” and one right-facing and labeled ”vaporization,” are drawn on top of the middle section of the second line.
The physical state of a substance and its phase-transition temperatures are represented graphically in a phase diagram.

To illustrate the utility of these plots, consider the phase diagram for water shown in [link] .

A graph is shown where the x-axis is labeled “Temperature in degrees Celsius” and the y-axis is labeled “Pressure ( k P a ).” A line extends from the origin of the graph which is labeled “A” sharply upward to a point in the bottom third of the diagram labeled “B” where it branches into a line that slants slightly backward until it hits the highest point on the y-axis labeled “D” and a second line that extends to the upper right corner of the graph labeled “C”. C is labeled “Critical point, with a dotted line extending downward to the x-axis labeled 374 degrees Celsius, and another dotted line extending to the y-axis labeled 22,089 k P a. The two lines bisect the graph area to create three sections, labeled “Ice (solid)” near the middle left, “Water (liquid)” in the top middle and “Water vapor (gas)” near the bottom middle. Point B is labeled “Triple point” and has a dotted line extending downward to the x-axis labeled 0.01, and another dotted line extending to the y-axis labeled 0.6. Halfway between points B and C a dotted line extends from the originally discussed line downward to the point 100 degrees Celsius on the x-axis, and another dotted line extends to the y-axis at 101 k P a. Another dotted line extends from this dotted line downward at 0 degrees Celsius.
The pressure and temperature axes on this phase diagram of water are not drawn to constant scale in order to illustrate several important properties.

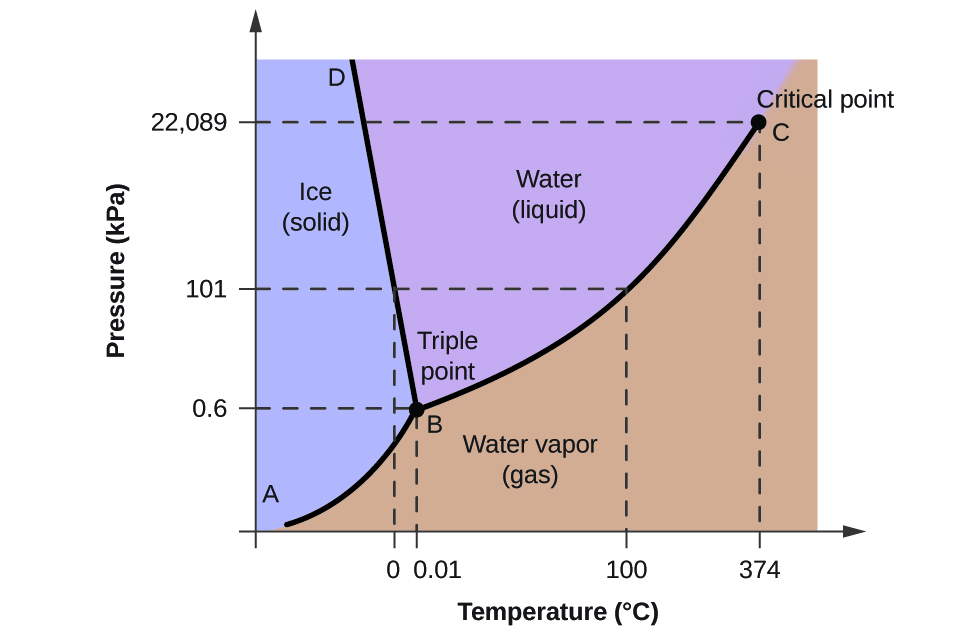
We can use the phase diagram to identify the physical state of a sample of water under specified conditions of pressure and temperature. For example, a pressure of 50 kPa and a temperature of −10 °C correspond to the region of the diagram labeled “ice.” Under these conditions, water exists only as a solid (ice). A pressure of 50 kPa and a temperature of 50 °C correspond to the “water” region—here, water exists only as a liquid. At 25 kPa and 200 °C, water exists only in the gaseous state. Note that on the H 2 O phase diagram, the pressure and temperature axes are not drawn to a constant scale in order to permit the illustration of several important features as described here.

The curve BC in [link] is the plot of vapor pressure versus temperature as described in the previous module of this chapter. This “liquid-vapor” curve separates the liquid and gaseous regions of the phase diagram and provides the boiling point for water at any pressure. For example, at 1 atm, the boiling point is 100 °C. Notice that the liquid-vapor curve terminates at a temperature of 374 °C and a pressure of 218 atm, indicating that water cannot exist as a liquid above this temperature, regardless of the pressure. The physical properties of water under these conditions are intermediate between those of its liquid and gaseous phases. This unique state of matter is called a supercritical fluid, a topic that will be described in the next section of this module.

Questions & Answers

how do you get the 2/50
Abba Reply
number of sport play by 50 student construct discrete data
Aminu Reply
width of the frangebany leaves on how to write a introduction
Theresa Reply
Solve the mean of variance
Veronica Reply
Step 1: Find the mean. To find the mean, add up all the scores, then divide them by the number of scores. ... Step 2: Find each score's deviation from the mean. ... Step 3: Square each deviation from the mean. ... Step 4: Find the sum of squares. ... Step 5: Divide the sum of squares by n – 1 or N.
kenneth
what is error
Yakuba Reply
Is mistake done to something
Vutshila
Hy
anas
hy
What is the life teble
anas
hy
Jibrin
statistics is the analyzing of data
Tajudeen Reply
what is statics?
Zelalem Reply
how do you calculate mean
Gloria Reply
diveving the sum if all values
Shaynaynay
let A1,A2 and A3 events be independent,show that (A1)^c, (A2)^c and (A3)^c are independent?
Fisaye Reply
what is statistics
Akhisani Reply
data collected all over the world
Shaynaynay
construct a less than and more than table
Imad Reply
The sample of 16 students is taken. The average age in the sample was 22 years with astandard deviation of 6 years. Construct a 95% confidence interval for the age of the population.
Aschalew Reply
Bhartdarshan' is an internet-based travel agency wherein customer can see videos of the cities they plant to visit. The number of hits daily is a normally distributed random variable with a mean of 10,000 and a standard deviation of 2,400 a. what is the probability of getting more than 12,000 hits? b. what is the probability of getting fewer than 9,000 hits?
Akshay Reply
Bhartdarshan'is an internet-based travel agency wherein customer can see videos of the cities they plan to visit. The number of hits daily is a normally distributed random variable with a mean of 10,000 and a standard deviation of 2,400. a. What is the probability of getting more than 12,000 hits
Akshay
1
Bright
Sorry i want to learn more about this question
Bright
Someone help
Bright
a= 0.20233 b=0.3384
Sufiyan
a
Shaynaynay
How do I interpret level of significance?
Mohd Reply
It depends on your business problem or in Machine Learning you could use ROC- AUC cruve to decide the threshold value
Shivam
how skewness and kurtosis are used in statistics
Owen Reply
yes what is it
Taneeya
Got questions? Join the online conversation and get instant answers!
Jobilize.com Reply
Practice Key Terms 4

Get Jobilize Job Search Mobile App in your pocket Now!

Get it on Google Play Download on the App Store Now


Source:  OpenStax, Chemistry. OpenStax CNX. May 20, 2015 Download for free at http://legacy.cnx.org/content/col11760/1.9
Google Play and the Google Play logo are trademarks of Google Inc.

Notification Switch

Would you like to follow the 'Chemistry' conversation and receive update notifications?

Ask