<< Chapter < Page Chapter >> Page >
Illustration shows a phylogenetic tree that starts at a root, indicating that all organisms on the tree share a common ancestor. Shortly after the root, the tree branches out. One branch gives rise to a single, basal lineage, and the other gives rise to all other organisms on the tree. The next branch forks at one point into four different lineages, an example of polytomy. The final branch gives rise to two lineages, an example of sister taxa.
The root of a phylogenetic tree indicates that an ancestral lineage gave rise to all organisms on the tree. A branch point indicates where two lineages diverged. A lineage that evolved early and remains unbranched is a basal taxon. When two lineages stem from the same branch point, they are sister taxa. A branch with more than two lineages is a polytomy.

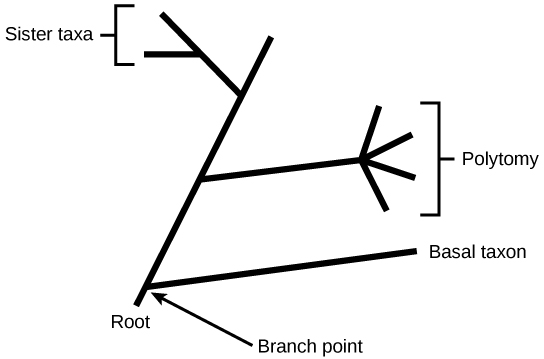
The diagrams above can serve as a pathway to understanding evolutionary history. The pathway can be traced from the origin of life to any individual species by navigating through the evolutionary branches between the two points. Also, by starting with a single species and tracing back towards the "trunk" of the tree, one can discover that species' ancestors, as well as where lineages share a common ancestry. In addition, the tree can be used to study entire groups of organisms.

Another point to mention on phylogenetic tree structure is that rotation at branch points does not change the information. For example, if a branch point was rotated and the taxon order changed, this would not alter the information because the evolution of each taxon from the branch point was independent of the other.

Many disciplines within the study of biology contribute to understanding how past and present life evolved over time; these disciplines together contribute to building, updating, and maintaining the “tree of life.” Information is used to organize and classify organisms based on evolutionary relationships in a scientific field called systematics    . Data may be collected from fossils, from studying the structure of body parts or molecules used by an organism, and by DNA analysis. By combining data from many sources, scientists can put together the phylogeny of an organism; since phylogenetic trees are hypotheses, they will continue to change as new types of life are discovered and new information is learned.

Limitations of phylogenetic trees

It may be easy to assume that more closely related organisms look more alike, and while this is often the case, it is not always true. If two closely related lineages evolved under significantly varied surroundings or after the evolution of a major new adaptation, it is possible for the two groups to appear more different than other groups that are not as closely related. For example, the phylogenetic tree in [link] shows that lizards and rabbits both have amniotic eggs, whereas frogs do not; yet lizards and frogs appear more similar than lizards and rabbits.

The ladder-like phylogenetic tree starts with a trunk at the left. A question next to the trunk asks whether a vertebral column is present. If the answer is no, a branch leads downward to lancelet. If the answer is yes, a branch leads upward to another question: is a hinged jaw present? If the answer is no, a branch leads downward to lamprey. If the answer is yes, a branch leads upward to another question: are legs present? If the answer is no, a branch leads downward to fish. If the answer is yes, a branch leads upward to another question: does the egg have amnion? If the answer is no, the branch leads downward to frog. If the answer is yes, the branch leads upward to another question: is hair present? If the answer is no, the branch leads downward to lizard. If the answer is yes, the branch leads upward to rabbit.
This ladder-like phylogenetic tree of vertebrates is rooted by an organism that lacked a vertebral column. At each branch point, organisms with different characters are placed in different groups based on the characteristics they share.

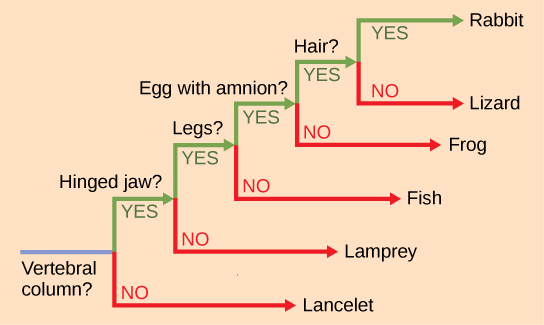
Another aspect of phylogenetic trees is that, unless otherwise indicated, the branches do not account for length of time, only the evolutionary order. In other words, the length of a branch does not typically mean more time passed, nor does a short branch mean less time passed— unless specified on the diagram. For example, in [link] , the tree does not indicate how much time passed between the evolution of amniotic eggs and hair. What the tree does show is the order in which things took place. Again using [link] , the tree shows that the oldest trait is the vertebral column, followed by hinged jaws, and so forth. Remember that any phylogenetic tree is a part of the greater whole, and like a real tree, it does not grow in only one direction after a new branch develops. So, for the organisms in [link] , just because a vertebral column evolved does not mean that invertebrate evolution ceased, it only means that a new branch formed. Also, groups that are not closely related, but evolve under similar conditions, may appear more phenotypically similar to each other than to a close relative.

Questions & Answers

What are the factors that affect demand for a commodity
Florence Reply
differentiate between demand and supply giving examples
Lambiv Reply
differentiated between demand and supply using examples
Lambiv
what is labour ?
Lambiv
how will I do?
Venny Reply
how is the graph works?I don't fully understand
Rezat Reply
information
Eliyee
devaluation
Eliyee
t
WARKISA
hi guys good evening to all
Lambiv
multiple choice question
Aster Reply
appreciation
Eliyee
explain perfect market
Lindiwe Reply
In economics, a perfect market refers to a theoretical construct where all participants have perfect information, goods are homogenous, there are no barriers to entry or exit, and prices are determined solely by supply and demand. It's an idealized model used for analysis,
Ezea
What is ceteris paribus?
Shukri Reply
other things being equal
AI-Robot
When MP₁ becomes negative, TP start to decline. Extuples Suppose that the short-run production function of certain cut-flower firm is given by: Q=4KL-0.6K2 - 0.112 • Where is quantity of cut flower produced, I is labour input and K is fixed capital input (K-5). Determine the average product of lab
Kelo
Extuples Suppose that the short-run production function of certain cut-flower firm is given by: Q=4KL-0.6K2 - 0.112 • Where is quantity of cut flower produced, I is labour input and K is fixed capital input (K-5). Determine the average product of labour (APL) and marginal product of labour (MPL)
Kelo
yes,thank you
Shukri
Can I ask you other question?
Shukri
what is monopoly mean?
Habtamu Reply
What is different between quantity demand and demand?
Shukri Reply
Quantity demanded refers to the specific amount of a good or service that consumers are willing and able to purchase at a give price and within a specific time period. Demand, on the other hand, is a broader concept that encompasses the entire relationship between price and quantity demanded
Ezea
ok
Shukri
how do you save a country economic situation when it's falling apart
Lilia Reply
what is the difference between economic growth and development
Fiker Reply
Economic growth as an increase in the production and consumption of goods and services within an economy.but Economic development as a broader concept that encompasses not only economic growth but also social & human well being.
Shukri
production function means
Jabir
What do you think is more important to focus on when considering inequality ?
Abdisa Reply
any question about economics?
Awais Reply
sir...I just want to ask one question... Define the term contract curve? if you are free please help me to find this answer 🙏
Asui
it is a curve that we get after connecting the pareto optimal combinations of two consumers after their mutually beneficial trade offs
Awais
thank you so much 👍 sir
Asui
In economics, the contract curve refers to the set of points in an Edgeworth box diagram where both parties involved in a trade cannot be made better off without making one of them worse off. It represents the Pareto efficient allocations of goods between two individuals or entities, where neither p
Cornelius
In economics, the contract curve refers to the set of points in an Edgeworth box diagram where both parties involved in a trade cannot be made better off without making one of them worse off. It represents the Pareto efficient allocations of goods between two individuals or entities,
Cornelius
Suppose a consumer consuming two commodities X and Y has The following utility function u=X0.4 Y0.6. If the price of the X and Y are 2 and 3 respectively and income Constraint is birr 50. A,Calculate quantities of x and y which maximize utility. B,Calculate value of Lagrange multiplier. C,Calculate quantities of X and Y consumed with a given price. D,alculate optimum level of output .
Feyisa Reply
Answer
Feyisa
c
Jabir
the market for lemon has 10 potential consumers, each having an individual demand curve p=101-10Qi, where p is price in dollar's per cup and Qi is the number of cups demanded per week by the i th consumer.Find the market demand curve using algebra. Draw an individual demand curve and the market dema
Gsbwnw Reply
suppose the production function is given by ( L, K)=L¼K¾.assuming capital is fixed find APL and MPL. consider the following short run production function:Q=6L²-0.4L³ a) find the value of L that maximizes output b)find the value of L that maximizes marginal product
Abdureman
Got questions? Join the online conversation and get instant answers!
Jobilize.com Reply

Get Jobilize Job Search Mobile App in your pocket Now!

Get it on Google Play Download on the App Store Now


Source:  OpenStax, Biology. OpenStax CNX. Feb 29, 2016 Download for free at http://cnx.org/content/col11448/1.10
Google Play and the Google Play logo are trademarks of Google Inc.

Notification Switch

Would you like to follow the 'Biology' conversation and receive update notifications?

Ask