<< Chapter < Page Chapter >> Page >

Learning objectives

By the end of this section, you will be able to:

  • Describe the general features of the surface of Venus
  • Explain what the study of craters on Venus tells us about the age of its surface
  • Compare tectonic activity and volcanoes on Venus with those of Earth
  • Explain why the surface of Venus is inhospitable to human life

Since Venus has about the same size and composition as Earth, we might expect its geology to be similar. This is partly true, but Venus does not exhibit the same kind of plate tectonics as Earth, and we will see that its lack of erosion results in a very different surface appearance.

Spacecraft exploration of venus

Nearly 50 spacecraft have been launched to Venus, but only about half were successful. Although the 1962 US Mariner 2 flyby was the first, the Soviet Union launched most of the subsequent missions to Venus. In 1970, Venera 7 became the first probe to land and broadcast data from the surface of Venus. It operated for 23 minutes before succumbing to the high surface temperature. Additional Venera probes and landers followed, photographing the surface and analyzing the atmosphere and soil.

To understand the geology of Venus, however, we needed to make a global study of its surface, a task made very difficult by the perpetual cloud layers surrounding the planet. The problem resembles the challenge facing air traffic controllers at an airport, when the weather is so cloudy or smoggy that they can’t locate the incoming planes visually. The solution is similar in both cases: use a radar instrument to probe through the obscuring layer.

The first global radar map was made by the US Pioneer Venus orbiter in the late 1970s, followed by better maps from the twin Soviet Venera 15 and 16 radar orbiters in the early 1980s. However, most of our information on the geology of Venus is derived from the US Magellan spacecraft, which mapped Venus with a powerful imaging radar . Magellan produced images with a resolution of 100 meters, much better than that of previous missions, yielding our first detailed look at the surface of our sister planet ( [link] ). (The Magellan spacecraft returned more data to Earth than all previous planetary missions combined; each 100 minutes of data transmission from the spacecraft provided enough information, if translated into characters, to fill two 30-volume encyclopedias.)

Radar map of venus.

False-color radar map of Venus. The hemisphere shown in this image has lower regions that lie at higher latitudes (top and bottom), and highlands in the equatorial zone (center).
This composite image has a resolution of about 3 kilometers. Colors have been added to indicate elevation, with blue meaning low and brown and white high. The large continent Aphrodite stretches around the equator, where the bright (therefore rough) surface has been deformed by tectonic forces in the crust of Venus . (credit: modification of work by NASA/JPL/USGS)

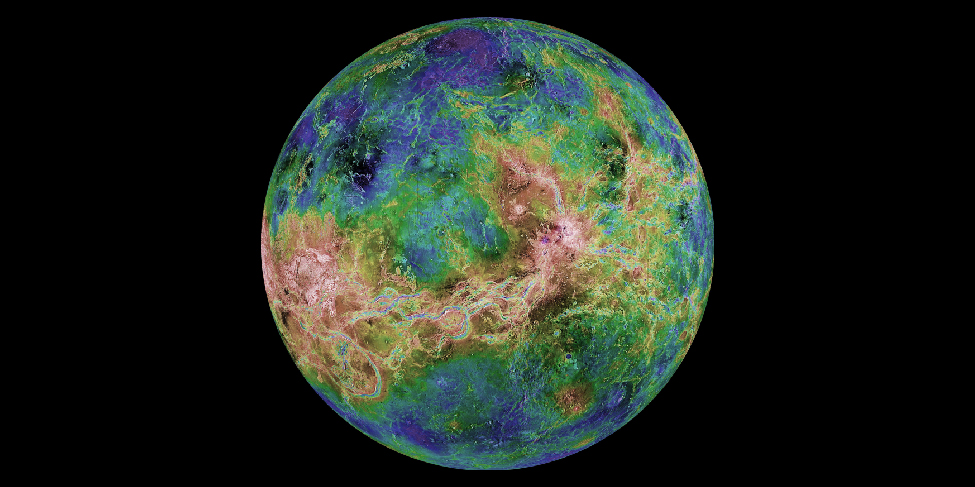
Consider for a moment how good Magellan ’s resolution of 100 meters really is. It means the radar images from Venus can show anything on the surface larger than a football field. Suddenly, a whole host of topographic features on Venus became accessible to our view. As you look at the radar images throughout this chapter, bear in mind that these are constructed from radar reflections, not from visible-light photographs. For example, bright features on these radar images are an indication of rough terrain, whereas darker regions are smoother.

Questions & Answers

What are the factors that affect demand for a commodity
Florence Reply
differentiate between demand and supply giving examples
Lambiv Reply
differentiated between demand and supply using examples
Lambiv
what is labour ?
Lambiv
how will I do?
Venny Reply
how is the graph works?I don't fully understand
Rezat Reply
information
Eliyee
devaluation
Eliyee
t
WARKISA
hi guys good evening to all
Lambiv
multiple choice question
Aster Reply
appreciation
Eliyee
explain perfect market
Lindiwe Reply
In economics, a perfect market refers to a theoretical construct where all participants have perfect information, goods are homogenous, there are no barriers to entry or exit, and prices are determined solely by supply and demand. It's an idealized model used for analysis,
Ezea
What is ceteris paribus?
Shukri Reply
other things being equal
AI-Robot
When MP₁ becomes negative, TP start to decline. Extuples Suppose that the short-run production function of certain cut-flower firm is given by: Q=4KL-0.6K2 - 0.112 • Where is quantity of cut flower produced, I is labour input and K is fixed capital input (K-5). Determine the average product of lab
Kelo
Extuples Suppose that the short-run production function of certain cut-flower firm is given by: Q=4KL-0.6K2 - 0.112 • Where is quantity of cut flower produced, I is labour input and K is fixed capital input (K-5). Determine the average product of labour (APL) and marginal product of labour (MPL)
Kelo
yes,thank you
Shukri
Can I ask you other question?
Shukri
what is monopoly mean?
Habtamu Reply
What is different between quantity demand and demand?
Shukri Reply
Quantity demanded refers to the specific amount of a good or service that consumers are willing and able to purchase at a give price and within a specific time period. Demand, on the other hand, is a broader concept that encompasses the entire relationship between price and quantity demanded
Ezea
ok
Shukri
how do you save a country economic situation when it's falling apart
Lilia Reply
what is the difference between economic growth and development
Fiker Reply
Economic growth as an increase in the production and consumption of goods and services within an economy.but Economic development as a broader concept that encompasses not only economic growth but also social & human well being.
Shukri
production function means
Jabir
What do you think is more important to focus on when considering inequality ?
Abdisa Reply
any question about economics?
Awais Reply
sir...I just want to ask one question... Define the term contract curve? if you are free please help me to find this answer 🙏
Asui
it is a curve that we get after connecting the pareto optimal combinations of two consumers after their mutually beneficial trade offs
Awais
thank you so much 👍 sir
Asui
In economics, the contract curve refers to the set of points in an Edgeworth box diagram where both parties involved in a trade cannot be made better off without making one of them worse off. It represents the Pareto efficient allocations of goods between two individuals or entities, where neither p
Cornelius
In economics, the contract curve refers to the set of points in an Edgeworth box diagram where both parties involved in a trade cannot be made better off without making one of them worse off. It represents the Pareto efficient allocations of goods between two individuals or entities,
Cornelius
Suppose a consumer consuming two commodities X and Y has The following utility function u=X0.4 Y0.6. If the price of the X and Y are 2 and 3 respectively and income Constraint is birr 50. A,Calculate quantities of x and y which maximize utility. B,Calculate value of Lagrange multiplier. C,Calculate quantities of X and Y consumed with a given price. D,alculate optimum level of output .
Feyisa Reply
Answer
Feyisa
c
Jabir
the market for lemon has 10 potential consumers, each having an individual demand curve p=101-10Qi, where p is price in dollar's per cup and Qi is the number of cups demanded per week by the i th consumer.Find the market demand curve using algebra. Draw an individual demand curve and the market dema
Gsbwnw Reply
suppose the production function is given by ( L, K)=L¼K¾.assuming capital is fixed find APL and MPL. consider the following short run production function:Q=6L²-0.4L³ a) find the value of L that maximizes output b)find the value of L that maximizes marginal product
Abdureman
Got questions? Join the online conversation and get instant answers!
Jobilize.com Reply
Practice Key Terms 1

Get Jobilize Job Search Mobile App in your pocket Now!

Get it on Google Play Download on the App Store Now


Source:  OpenStax, Astronomy. OpenStax CNX. Apr 12, 2017 Download for free at http://cnx.org/content/col11992/1.13
Google Play and the Google Play logo are trademarks of Google Inc.

Notification Switch

Would you like to follow the 'Astronomy' conversation and receive update notifications?

Ask