<< Chapter < Page Chapter >> Page >

Clouds and atmospheric structure

The clouds of Jupiter ( [link] ) are among the most spectacular sights in the solar system, much beloved by makers of science-fiction films. They range in color from white to orange to red to brown, swirling and twisting in a constantly changing kaleidoscope of patterns. Saturn shows similar but much more subdued cloud activity; instead of vivid colors, its clouds have a nearly uniform butterscotch hue ( [link] ).

Jupiter’s colorful clouds.

Jupiter’s Dynamic Clouds. The oranges, reddish browns, taupes and beiges of Jupiter’s dynamic atmosphere are seen swirling around the Great Red Spot in this close-up image of Jupiter.
The vibrant colors of the clouds on Jupiter present a puzzle to astronomers: given the cool temperatures and the composition of nearly 90% hydrogen, the atmosphere should be colorless. One hypothesis suggests that perhaps colorful hydrogen compounds rise from warm areas. The actual colors are a bit more muted, as shown in [link] . (credit: modification of work by Voyager Project, JPL, and NASA)

Different gases freeze at different temperatures. At the temperatures and pressures of the upper atmospheres of Jupiter and Saturn, methane remains a gas, but ammonia can condense and freeze. (Similarly, water vapor condenses high in Earth’s atmosphere to produce clouds of ice crystals.) The primary clouds that we see around these planets, whether from a spacecraft or through a telescope, are composed of frozen ammonia crystals. The ammonia clouds mark the upper edge of the planets’ tropospheres; above that is the stratosphere, the coldest part of the atmosphere. (These layers were initially defined in Earth as a Planet .)

Saturn over five years.

The Changing Angle of Saturn’s Rings. Five images clearly illustrating the 27° tilt of Saturn’s rings. At lower left, the rings are seen nearly edge on, and the Cassini division is difficult to see. Moving toward the upper right, the rings tilt to their maximum angle as seen from Earth, with the planet obscuring only a small portion of the rings.
These beautiful images of Saturn were recorded by the Hubble Space Telescope between 1996 and 2000. Since Saturn is tilted by 27°, we see the orientation of Saturn’s rings around its equator change as the planet moves along its orbit. Note the horizontal bands in the atmosphere. (credit: modification of work by NASA and The Hubble Heritage Team (STScI/AURA))

The diagrams in [link] show the structure and clouds in the atmospheres of all four jovian planets. On both Jupiter and Saturn, the temperature near the cloud tops is about 140 K (only a little cooler than the polar caps of Mars). On Jupiter, this cloud level is at a pressure of about 0.1 bar (one tenth the atmospheric pressure at the surface of Earth), but on Saturn it occurs lower in the atmosphere, at about 1 bar. Because the ammonia clouds lie so much deeper on Saturn, they are more difficult to see, and the overall appearance of the planet is much blander than is Jupiter’s appearance.

Atmospheric structure of the jovian planets.

This plot has four panels, with the vertical axis labeled “Altitude (km)”, ranging from -300 km at the bottom to 200 km at the top in increments of 100 km. The horizontal axis is labeled “Temperature (K)”, ranging from zero at left to 300 at right, in increments of 100 K. The left panel is of Jupiter. A yellow curve showing the variation of temperature with altitude is plotted, and begins at 300 K at -100 km. The curve moves upward to the left and reaches the minimum temperature of 100 K at zero km. The curve then moves to the right, and stops at about 150 K at 150 km. Also plotted are various cloud types and their composition, drawn as irregular blobs. At -100 km “H2O” clouds are plotted, “NH4HS” clouds are plotted at about -50 km, “NH3” clouds are drawn at about -25 km, finally “N2H4(?)” clouds are shown above 100 km. Next is Saturn. A yellow curve showing the variation of temperature with altitude is plotted, and begins at 300 K at -300 km. The curve moves upward to the left and reaches the minimum temperature of about 100 K at zero km. The curve then moves to the right, and stops at about 150 K at 200 km. Also plotted are various cloud types and their composition, drawn as irregular blobs. At -250 km “H2O” clouds are plotted, “NH4HS” clouds are plotted at about -150 km, “NH3” clouds are drawn at about -100 km, finally “P2H4(?)” clouds are shown above 100 km. Next is Uranus. A yellow curve showing the variation of temperature with altitude is plotted, and begins at 150 K at -150 km. The curve moves upward to the left and reaches the minimum temperature of about 50 K at zero km. The curve then moves to the right, and stops at about 100 K at 150 km. Also plotted are various cloud types and their composition, drawn as irregular blobs. At -100 km “H2S?” clouds are plotted, “CH4” clouds are plotted at about -50 km, finally “Hydrocarbon ices” are shown above zero km. Finally, at right, is Neptune. A yellow curve showing the variation of temperature with altitude is plotted, and begins at 280 K at -300 km. The curve moves upward to the left and reaches the minimum temperature of about 50 K at zero km. The curve then moves to the right, and stops at about 80 K at 200 km. Also plotted are various cloud types and their composition, drawn as irregular blobs. At -100 km “H2S?” clouds are plotted, “CH4” clouds are plotted at about -50 km, finally “Hydrocarbon ices” are shown above zero km.
In each diagram, the yellow line shows how the temperature (see the scale on the bottom) changes with altitude (see the scale at the left). The location of the main layers on each planet is also shown.

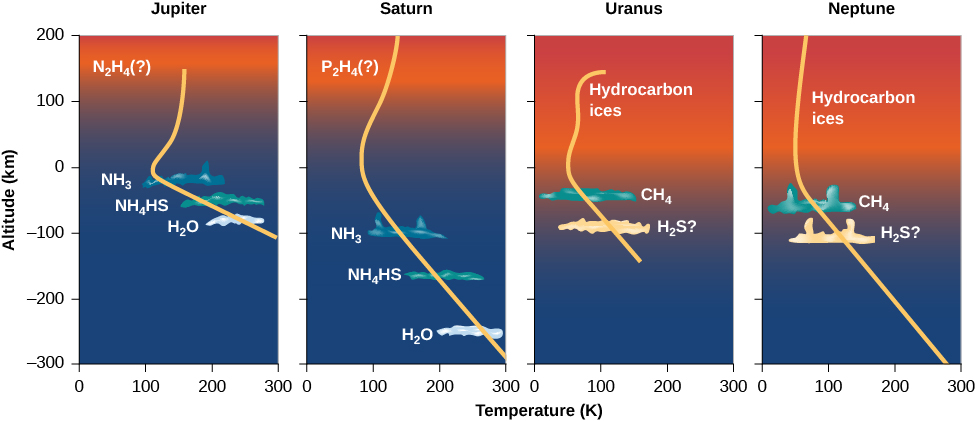
Within the tropospheres of these planets, the temperature and pressure both increase with depth. Through breaks in the ammonia clouds, we can see tantalizing glimpses of other cloud layers that can form in these deeper regions of the atmosphere—regions that were sampled directly for Jupiter by the Galileo probe that fell into the planet.

Questions & Answers

prostaglandin and fever
Maha Reply
Discuss the differences between taste and flavor, including how other sensory inputs contribute to our  perception of flavor.
John Reply
taste refers to your understanding of the flavor . while flavor one The other hand is refers to sort of just a blend things.
Faith
While taste primarily relies on our taste buds, flavor involves a complex interplay between taste and aroma
Kamara
which drugs can we use for ulcers
Ummi Reply
omeprazole
Kamara
what
Renee
what is this
Renee
is a drug
Kamara
of anti-ulcer
Kamara
Omeprazole Cimetidine / Tagament For the complicated once ulcer - kit
Patrick
what is the function of lymphatic system
Nency Reply
Not really sure
Eli
to drain extracellular fluid all over the body.
asegid
The lymphatic system plays several crucial roles in the human body, functioning as a key component of the immune system and contributing to the maintenance of fluid balance. Its main functions include: 1. Immune Response: The lymphatic system produces and transports lymphocytes, which are a type of
asegid
to transport fluids fats proteins and lymphocytes to the blood stream as lymph
Adama
what is anatomy
Oyindarmola Reply
Anatomy is the identification and description of the structures of living things
Kamara
what's the difference between anatomy and physiology
Oyerinde Reply
Anatomy is the study of the structure of the body, while physiology is the study of the function of the body. Anatomy looks at the body's organs and systems, while physiology looks at how those organs and systems work together to keep the body functioning.
AI-Robot
what is enzymes all about?
Mohammed Reply
Enzymes are proteins that help speed up chemical reactions in our bodies. Enzymes are essential for digestion, liver function and much more. Too much or too little of a certain enzyme can cause health problems
Kamara
yes
Prince
how does the stomach protect itself from the damaging effects of HCl
Wulku Reply
little girl okay how does the stomach protect itself from the damaging effect of HCL
Wulku
it is because of the enzyme that the stomach produce that help the stomach from the damaging effect of HCL
Kamara
function of digestive system
Ali Reply
function of digestive
Ali
the diagram of the lungs
Adaeze Reply
what is the normal body temperature
Diya Reply
37 degrees selcius
Xolo
37°c
Stephanie
please why 37 degree selcius normal temperature
Mark
36.5
Simon
37°c
Iyogho
the normal temperature is 37°c or 98.6 °Fahrenheit is important for maintaining the homeostasis in the body the body regular this temperature through the process called thermoregulation which involves brain skin muscle and other organ working together to maintain stable internal temperature
Stephanie
37A c
Wulku
what is anaemia
Diya Reply
anaemia is the decrease in RBC count hemoglobin count and PVC count
Eniola
what is the pH of the vagina
Diya Reply
how does Lysin attack pathogens
Diya
acid
Mary
I information on anatomy position and digestive system and there enzyme
Elisha Reply
anatomy of the female external genitalia
Muhammad Reply
Got questions? Join the online conversation and get instant answers!
Jobilize.com Reply

Get Jobilize Job Search Mobile App in your pocket Now!

Get it on Google Play Download on the App Store Now


Source:  OpenStax, Astronomy. OpenStax CNX. Apr 12, 2017 Download for free at http://cnx.org/content/col11992/1.13
Google Play and the Google Play logo are trademarks of Google Inc.

Notification Switch

Would you like to follow the 'Astronomy' conversation and receive update notifications?

Ask