<< Chapter < Page Chapter >> Page >

Learning objectives

By the end of this section, you will be able to:

  • Distinguish the different types of binary star systems
  • Understand how we can apply Newton’s version of Kepler’s third law to derive the sum of star mass es in a binary star system
  • Apply the relationship between stellar mass and stellar luminosity to determine the physical characteristics of a star

The mass of a star—how much material it contains—is one of its most important characteristics. If we know a star’s mass, as we shall see, we can estimate how long it will shine and what its ultimate fate will be. Yet the mass of a star is very difficult to measure directly. Somehow, we need to put a star on the cosmic equivalent of a scale.

Luckily, not all stars live like the Sun, in isolation from other stars. About half the stars are binary stars    —two stars that orbit each other, bound together by gravity. Masses of binary stars can be calculated from measurements of their orbits, just as the mass of the Sun can be derived by measuring the orbits of the planets around it (see Orbits and Gravity ).

Binary stars

Before we discuss in more detail how mass can be measured, we will take a closer look at stars that come in pairs. The first binary star was discovered in 1650, less than half a century after Galileo began to observe the sky with a telescope. John Baptiste Riccioli (1598–1671), an Italian astronomer, noted that the star Mizar, in the middle of the Big Dipper’s handle, appeared through his telescope as two stars. Since that discovery, thousands of binary stars have been cataloged. (Astronomers call any pair of stars that appear to be close to each other in the sky double stars , but not all of these form a true binary, that is, not all of them are physically associated. Some are just chance alignments of stars that are actually at different distances from us.) Although stars most commonly come in pairs, there are also triple and quadruple systems.

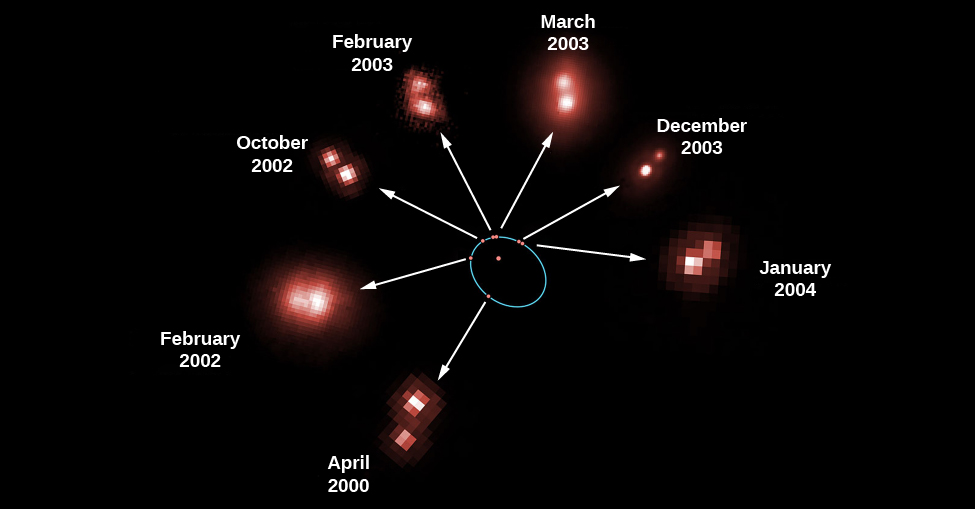
One well-known binary star is Castor, located in the constellation of Gemini. By 1804, astronomer William Herschel , who also discovered the planet Uranus, had noted that the fainter component of Castor had slightly changed its position relative to the brighter component. (We use the term “component” to mean a member of a star system.) Here was evidence that one star was moving around another. It was actually the first evidence that gravitational influences exist outside the solar system. The orbital motion of a binary star is shown in [link] . A binary star system in which both of the stars can be seen with a telescope is called a visual binary    .

Revolution of a binary star.

Revolution of a Binary Star. This figure shows seven observations of the mutual revolution of two stars, one a brown dwarf and one an ultra-cool L dwarf. At center one of the stars is drawn as a red dot surrounded by a blue ellipse. The positions of the companion star at seven different dates are shown as red dots along the blue ellipse. A white arrow points from each red dot on the ellipse to an actual image of the system. Moving clockwise from lower left around the ellipse the observation dates for the individual images are, “April 2000”, “February 2002”, “October 2002”, “February 2003”, “March 2003”, “December 2003” and “January 2004”.
This figure shows seven observations of the mutual revolution of two stars, one a brown dwarf and one an ultra-cool L dwarf. Each red dot on the orbit, which is shown by the blue ellipse, corresponds to the position of one of the dwarfs relative to the other. The reason that the pair of stars looks different on the different dates is that some images were taken with the Hubble Space Telescope and others were taken from the ground. The arrows point to the actual observations that correspond to the positions of each red dot. From these observations, an international team of astronomers directly measured the mass of an ultra-cool brown dwarf star for the first time. Barely the size of the planet Jupiter, the dwarf star weighs in at just 8.5% of the mass of our Sun. (credit: modification of work by ESA/NASA and Herve Bouy (Max-Planck-Institut für Extraterrestrische Physik/ESO, Germany))

Questions & Answers

how do you get the 2/50
Abba Reply
number of sport play by 50 student construct discrete data
Aminu Reply
width of the frangebany leaves on how to write a introduction
Theresa Reply
Solve the mean of variance
Veronica Reply
Step 1: Find the mean. To find the mean, add up all the scores, then divide them by the number of scores. ... Step 2: Find each score's deviation from the mean. ... Step 3: Square each deviation from the mean. ... Step 4: Find the sum of squares. ... Step 5: Divide the sum of squares by n – 1 or N.
kenneth
what is error
Yakuba Reply
Is mistake done to something
Vutshila
Hy
anas
hy
What is the life teble
anas
hy
Jibrin
statistics is the analyzing of data
Tajudeen Reply
what is statics?
Zelalem Reply
how do you calculate mean
Gloria Reply
diveving the sum if all values
Shaynaynay
let A1,A2 and A3 events be independent,show that (A1)^c, (A2)^c and (A3)^c are independent?
Fisaye Reply
what is statistics
Akhisani Reply
data collected all over the world
Shaynaynay
construct a less than and more than table
Imad Reply
The sample of 16 students is taken. The average age in the sample was 22 years with astandard deviation of 6 years. Construct a 95% confidence interval for the age of the population.
Aschalew Reply
Bhartdarshan' is an internet-based travel agency wherein customer can see videos of the cities they plant to visit. The number of hits daily is a normally distributed random variable with a mean of 10,000 and a standard deviation of 2,400 a. what is the probability of getting more than 12,000 hits? b. what is the probability of getting fewer than 9,000 hits?
Akshay Reply
Bhartdarshan'is an internet-based travel agency wherein customer can see videos of the cities they plan to visit. The number of hits daily is a normally distributed random variable with a mean of 10,000 and a standard deviation of 2,400. a. What is the probability of getting more than 12,000 hits
Akshay
1
Bright
Sorry i want to learn more about this question
Bright
Someone help
Bright
a= 0.20233 b=0.3384
Sufiyan
a
Shaynaynay
How do I interpret level of significance?
Mohd Reply
It depends on your business problem or in Machine Learning you could use ROC- AUC cruve to decide the threshold value
Shivam
how skewness and kurtosis are used in statistics
Owen Reply
yes what is it
Taneeya
Got questions? Join the online conversation and get instant answers!
Jobilize.com Reply
Practice Key Terms 5

Get Jobilize Job Search Mobile App in your pocket Now!

Get it on Google Play Download on the App Store Now


Source:  OpenStax, Astronomy. OpenStax CNX. Apr 12, 2017 Download for free at http://cnx.org/content/col11992/1.13
Google Play and the Google Play logo are trademarks of Google Inc.

Notification Switch

Would you like to follow the 'Astronomy' conversation and receive update notifications?

Ask